Wave Models are quite difficult and complex. Unfortunately, many times they are needed, there is not much time to let then run. The method discussed, while not perfect, can at least give a quick analysis to help during an emergency.
During Hurricane Sandy, this was a question that was asked. The method I used was, while simple, quick enough for the analysis, but accurate in a way. Using the lake level data at the time of the storm, and LiDAR data, I classified out a shoreline at 5 and 10 feet above the current low water level.

This data was then compared to a parcel feature class that was spatially joined to the fire districts. This allowed to sort by fire district so the correct responders could help with the evacuation. The intersected areas then were used to create a database for responders to sort and distribute between themselves.

As you can see, the parcels selected were more than just the lake shore. This was because of the low lying areas around the bays and tributaries of Lake Ontario. The model did not take into account features such as break walls and natural wave barriers which would prevent these areas from being impacted. But in the short timeframe of the storm it was sufficient to help get the dialog started.
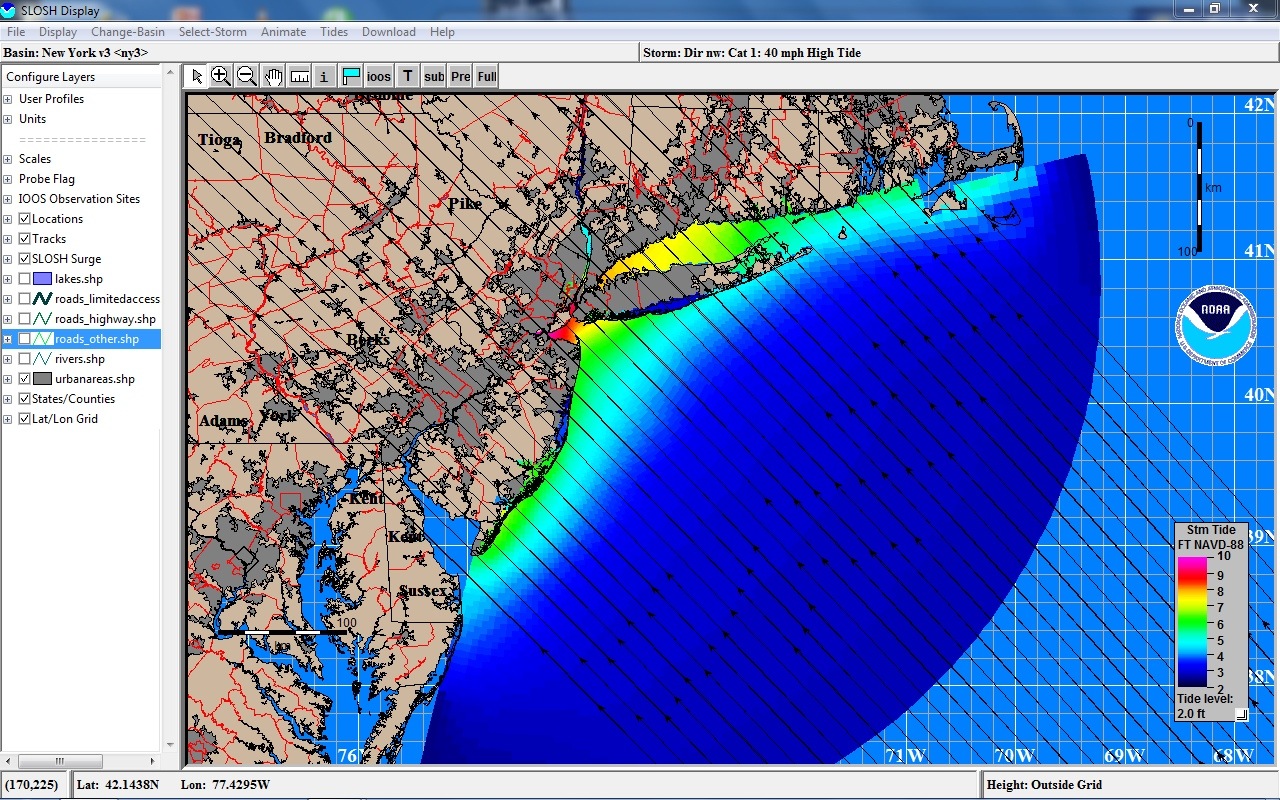
I have already started future work to create a better wave model. The first phase has been to look into NOAA’s Sea, Lake, and Overland Surges from Hurricanes (SLOSH) model. This model was designed for this very type of analysis and is generated before storms so a Pre-can analysis can be brought up quickly. The processing is much more difficult and currently I cannot find tools to create the beginning models. Once I get the tools, I plan to create such a model for the lake so a more accurate model can exist.
Useful Links
NOAA Digital Coasts – http://www.csc.noaa.gov/digitalcoast/
Sea, Lake, and Overland Surges from Hurricanes (SLOSH) – http://www.nhc.noaa.gov/ssurge/ssurge_slosh.shtml
Great Lakes Water Level Data – http://tidesandcurrents.noaa.gov/data_menu.shtml?bdate=20130102&edate=20130103&datum=0&unit=0&shift=s&stn=9052058+Rochester%2C+NY&type=Great+Lakes+Water+Level+Data&format=View+Plot
Modeling Coastal Wetland Change Due to Lake Level Fluctuations – http://proceedings.esri.com/library/userconf/proc10/UC/abstracts/a1091.html
