In Part 1 we covered the basics of getting the census data and doing a simple join. Now in Part 2, we will work on making this data both more usable and accessible using the database design tools in ArcGIS Pro and also Publishing this data to ArcGIS Online for use in your own web applications.
SETTING ALIASES
One of the easiest ways to improve the usability and readability of census data is to set the aliases and numeric formats before working with the data. Doing it before we work, will save us time in editing the legends and final products. We can go into the fields and edit these using in either view in ArcGIS Pro, but I will show it using the catalog.
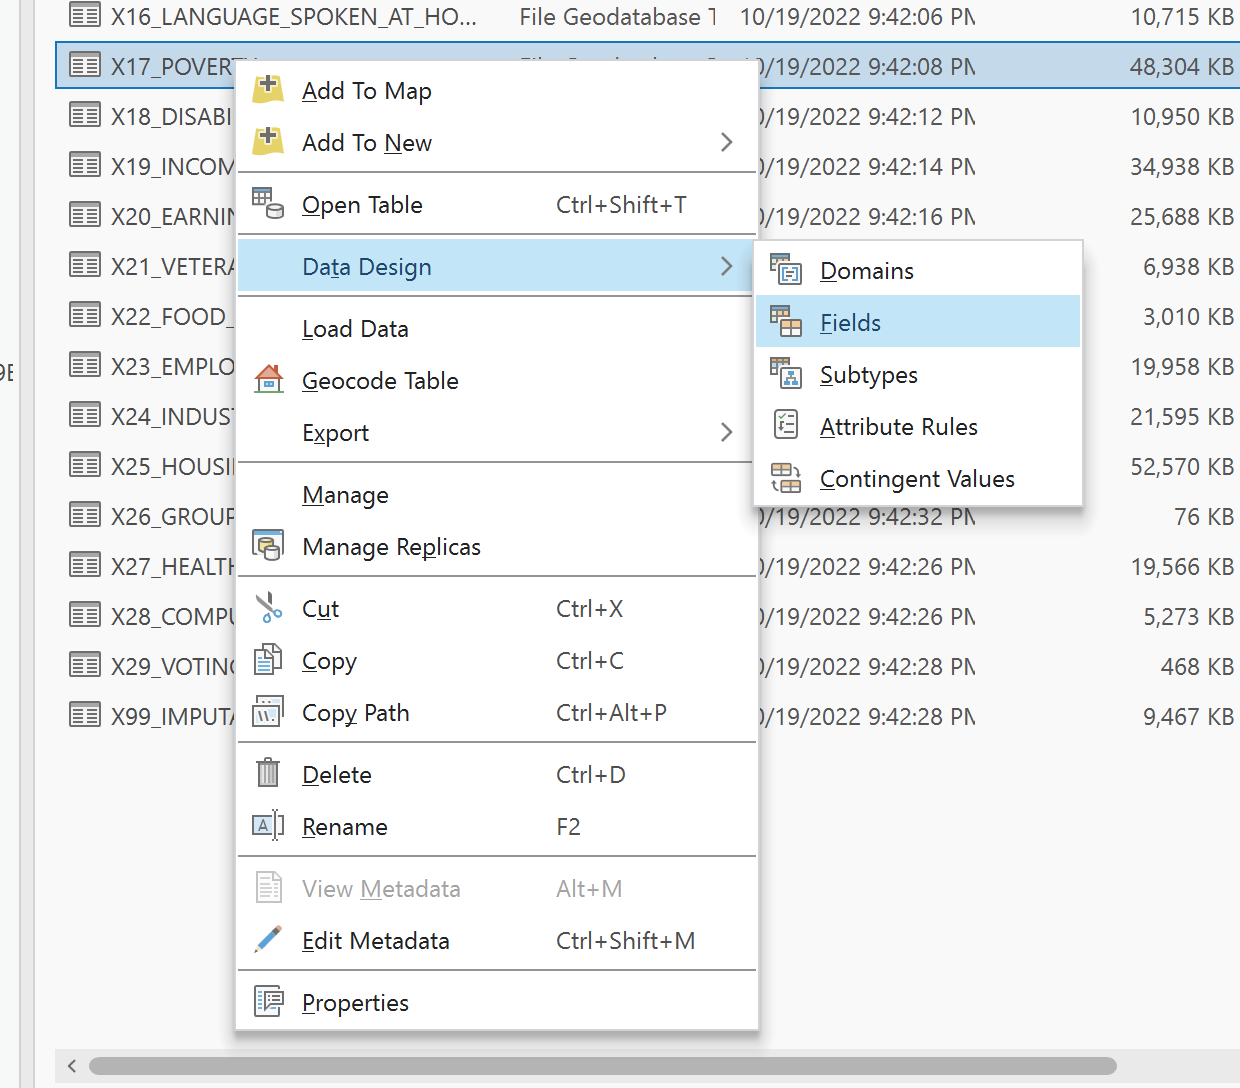
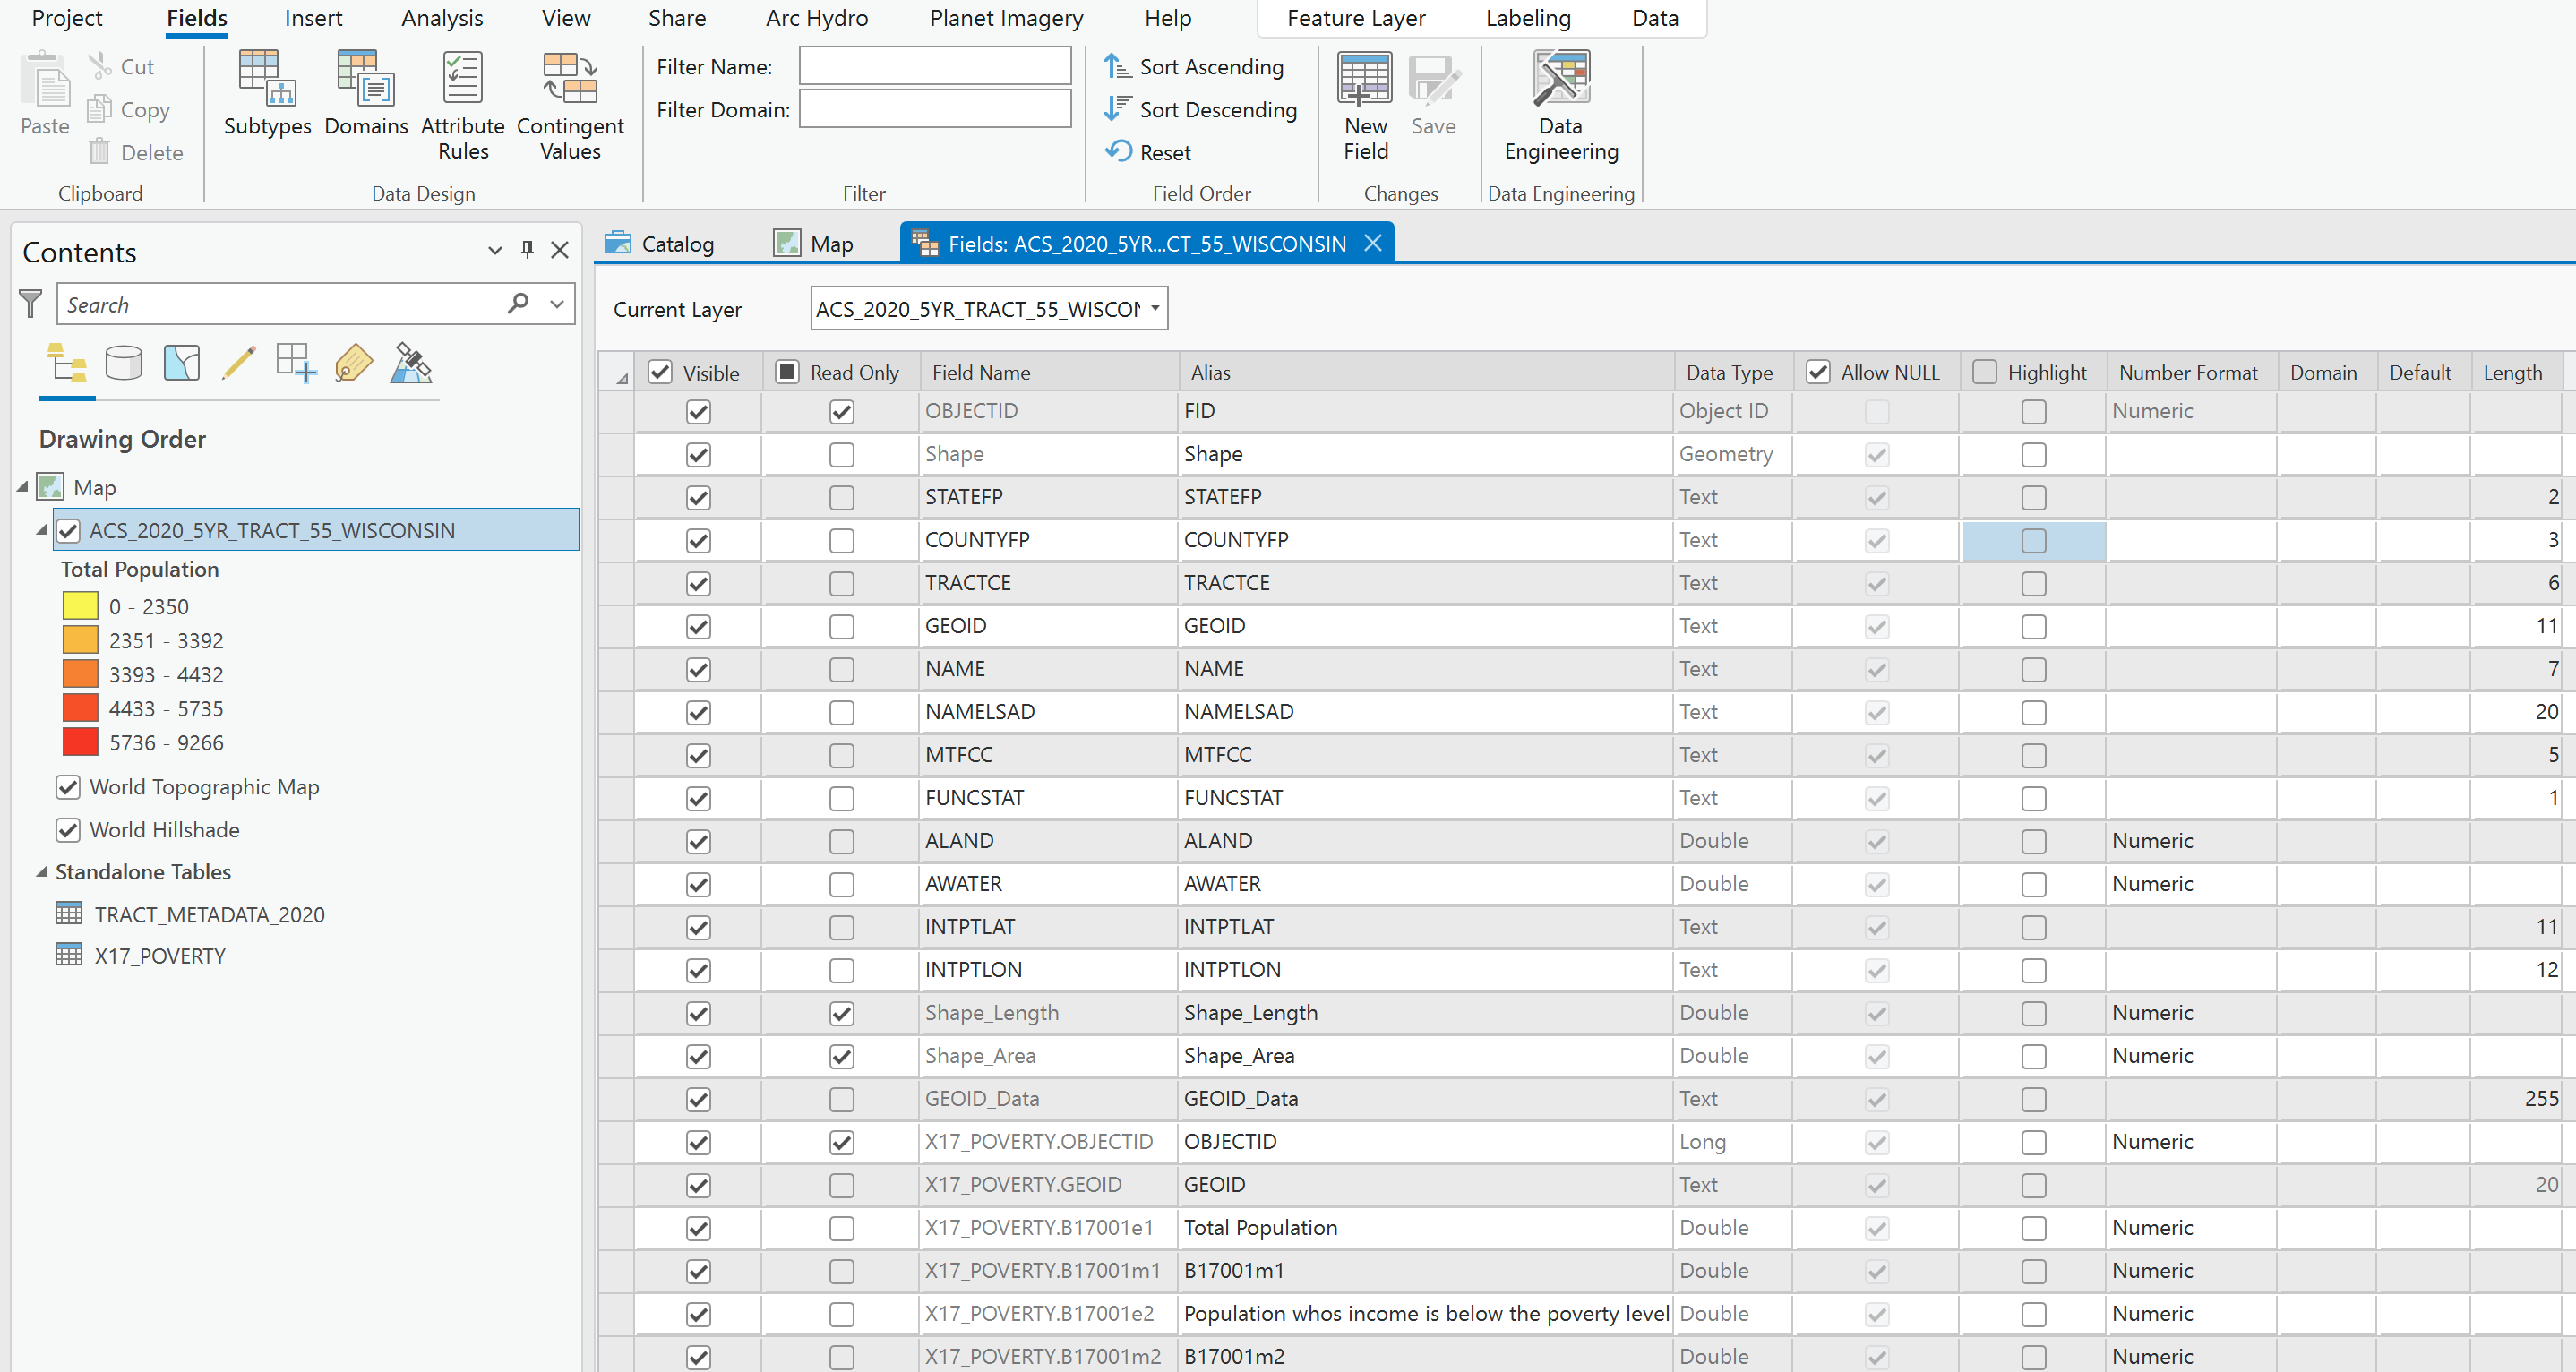
Right-click on the table you want to work with, in this example, I will use the poverty table, and then go to Data Design -> Fields. We will also use this function shortly to add new fields.
In the Fields Tab and Ribbon, you will have the see various tools and functions like how to add domains, subtypes, and rules. If you are designing new geodatabases, domains, rules, and subtypes are very important, but because we are using existing data, they are less so because the originator should have taken those into consideration. What we will do is go through a few of the attributes and fill out the aliases.
Aliases allow you to have more complete names than the constraints that are imposed by the field names. In an alias, you can have spaces, more characters, and can have numbers in the beginning. You can populate the alias when designing the database, or you can do what we are about to do and add them afterward. To populate an alias, just click on the empty alias box next to the field that are working with and then type it in.

Now we have the aliases for a few fields. You would want to have any fields that you want to use. Then when you join the data this will be reflected in the data.

CHANGING NUMERIC FORMATS
One of the issues using census data is how the numbers are presented when ArcGIS breaks down the data. You never think of population as being a decimal of a person and so the numeric format should reflect that. To do that when you are in the fields window you will see a Numeric Format Column. Click the Numeric next to the field you want to change and you can then set the type of number (percentage, money, or just numeric). You can also set the number of Decimal or Significant Places. Once you set that you can click ok and then save the changes.
If you have already worked with symbology before making this change you will just need to force a reload. Just pick a different field and go back to the field you want and the numeric format will be already loaded and labels will be all set.

Adding New Fields and TRANSFERRING the Data
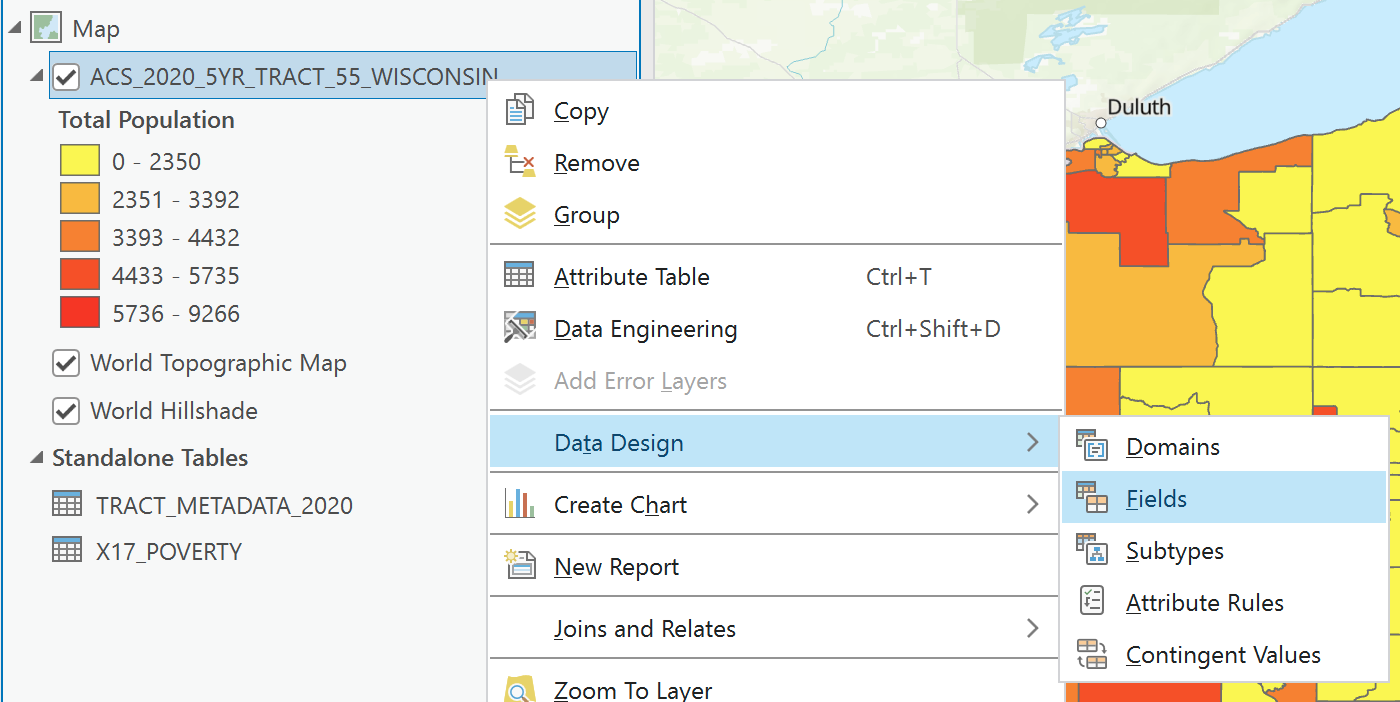
Adding new fields is an easy process. Start off by right-clicking on the layer in your contents window. Navigate to the Data Design and then Fields.
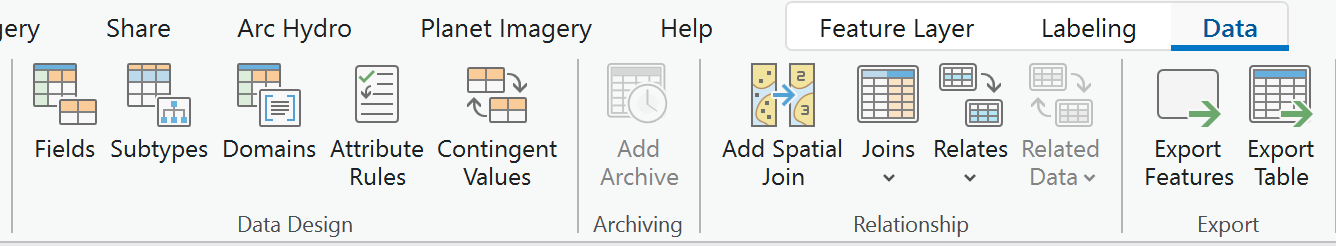
You can also find the fields under the Data ribbon when you select the layer.
Once in the fields window, you will see all of the fields of the layer (or if it is joined both the layer and table). In order to make the new field you will need to scroll all the way to the bottom.
At the bottom, you will see “Click Here to Create New Field”. Click that row and it will turn green. Fill out the field with the field name (no spaces and no numbers in the first character), alias (can have spaces), data type (should match the original table), and if you want you can set the numeric format here.
Move Data into the New Field by Calculating the Field
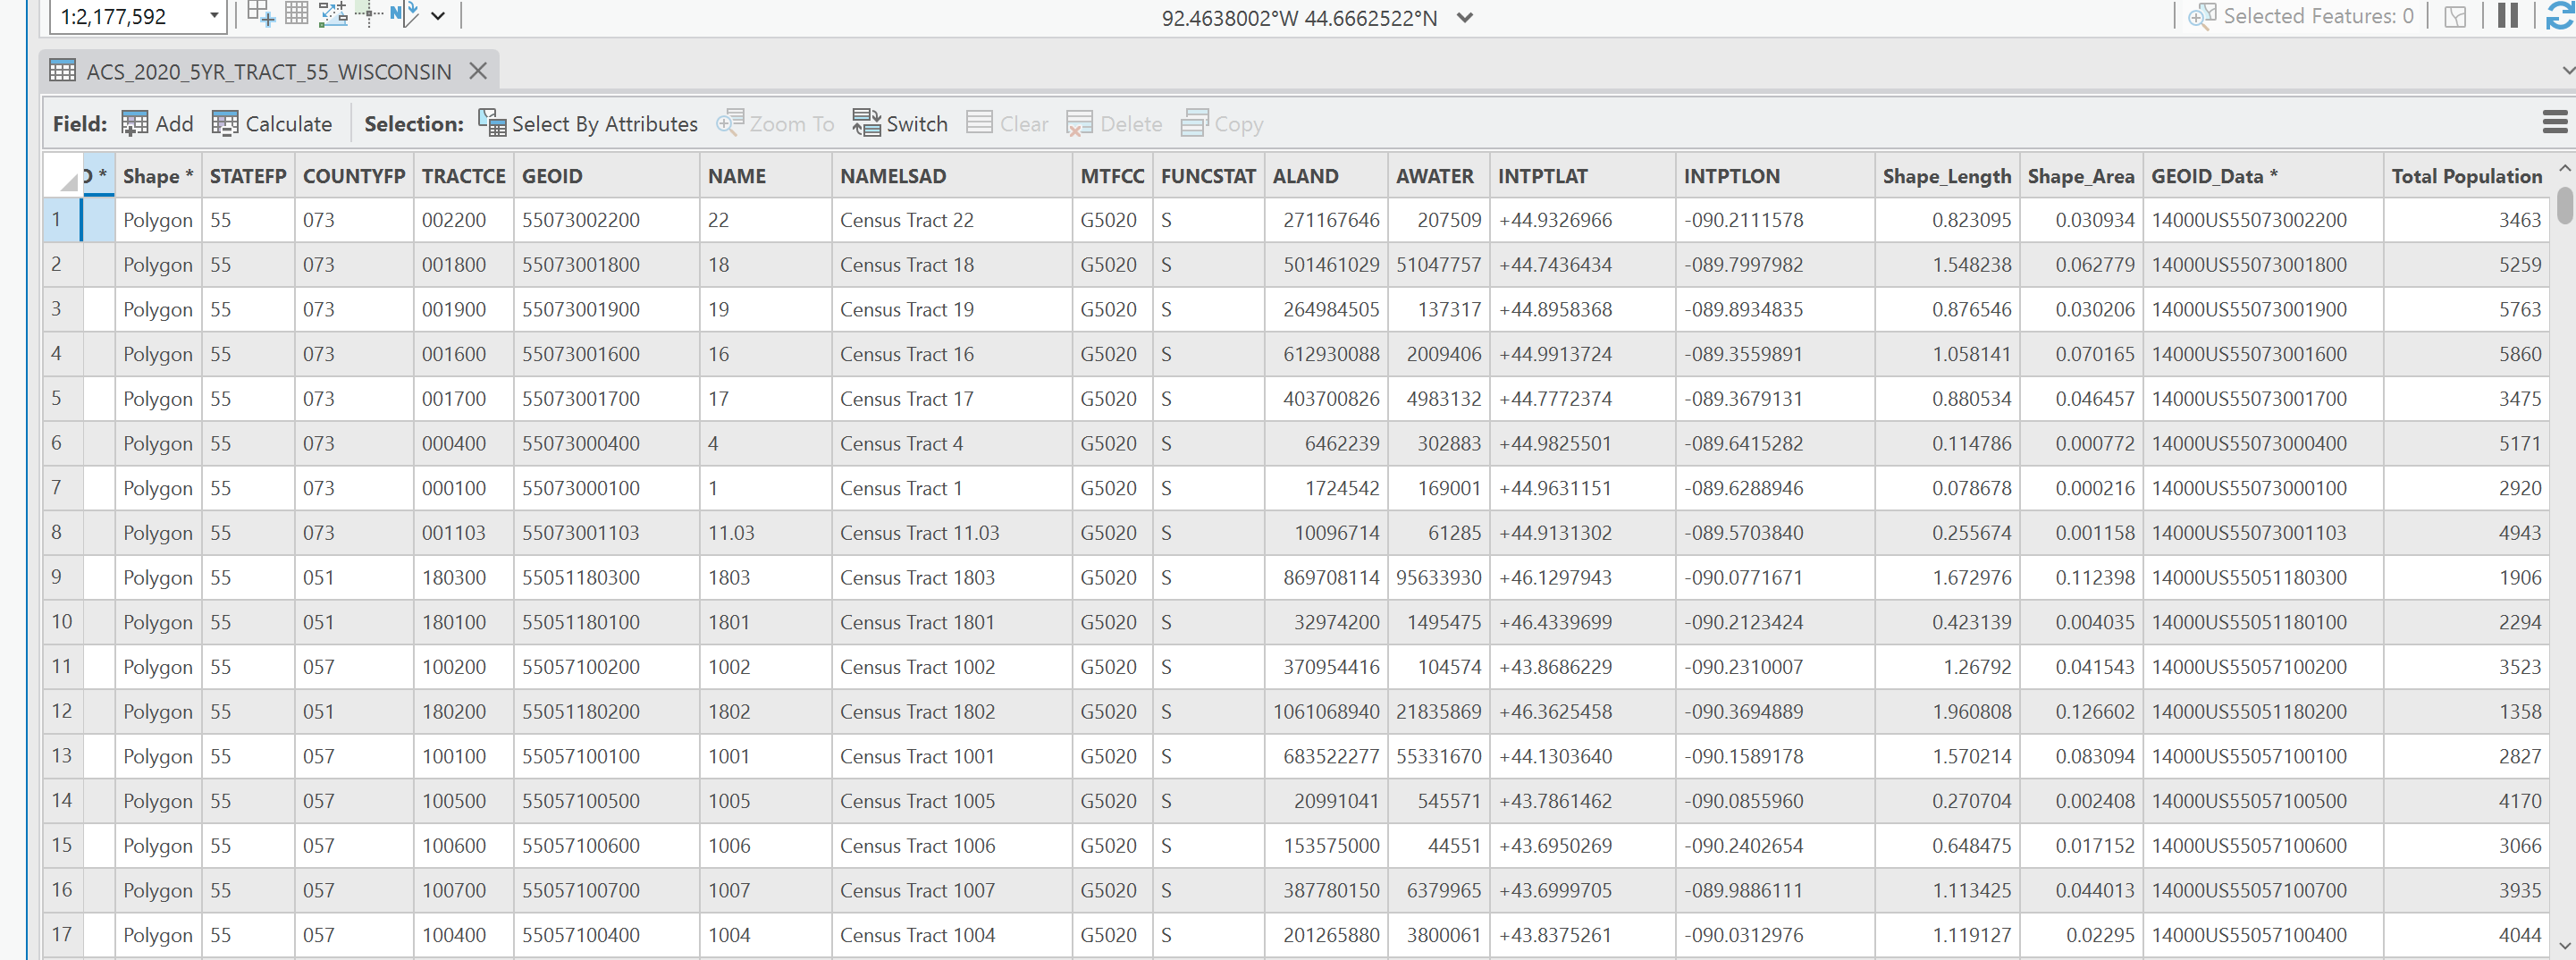
Now you can go back to your map and calculate the data in the new field. Close the fields tab, and then you should be back on your map. Right-click on the layer in the contents and open the attribute table. Then scroll to find the new field. Then you can hit calculate field.

In the Calculate Field window make sure the Field Name is your new Field and then just set the equation equal to the field that you want to transfer the data from. Because we used the same field type it should transfer easily. Also if you wanted a new field, like population density or percent of people in poverty, you can use the calculate field to accomplish that.

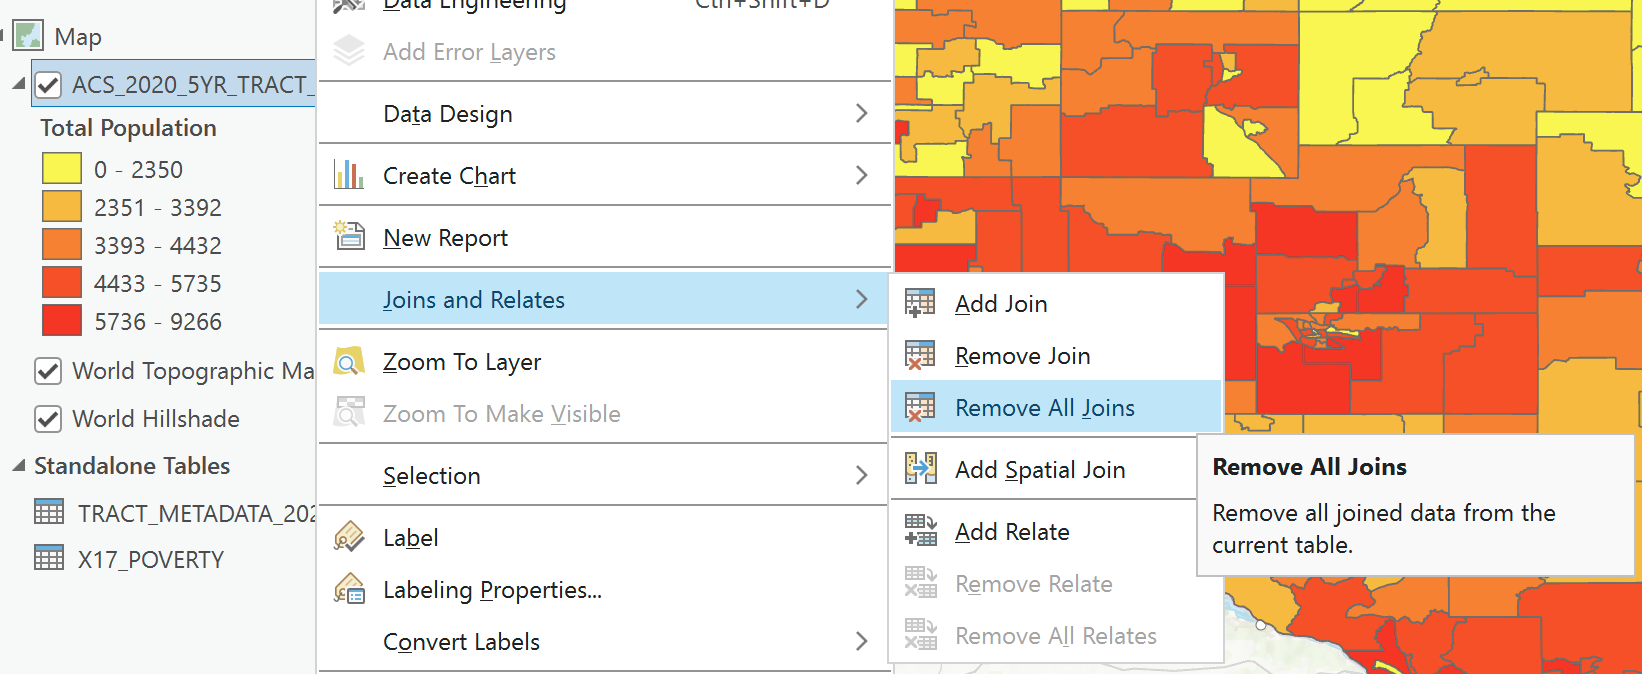
Once you have the fields you want, remove the join by right click the layer and then go to joins and relates and remove all joins. This will leave you with just the default layer fields and any ones that you created. You will have to update any symbology to use the new field after the join has been removed. (Note: Joins cannot be published in ArcGIS Online)
Alternative – Making the Join Permanent and Deleting the EXCESS Fields
As I mentioned above, joins are not supported in ArcGIS Online and so you will need to do the new field method or you will need to make the join permanent. Making the join permanent, is not difficult but the sheer number of attributes will cause some issues for ArcGIS Online, so after this section, I will cover how to delete the excess fields.
The easiest way to make the join permanent is to right click the layer and then go Data and export features.

This will give you the Export Features Dialog. The very first thing to do is to set the name to something meaningful like, in my example, WisconsinPoverty2020Tract (Do Not Keep ExportFeature because you will probably make a lot and then have no idea which is which).
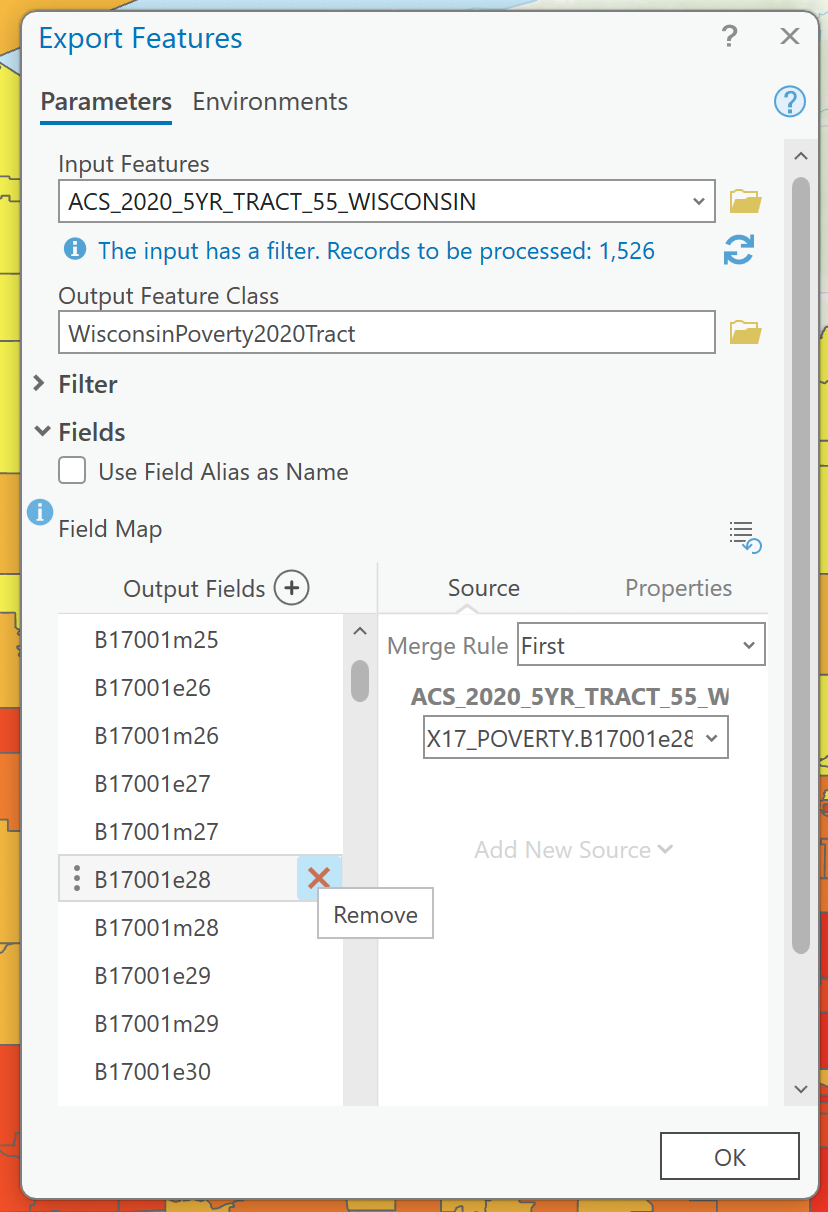
One of the other good things about this dialog box is you can change the alias, add new fields, or even remove extra fields. Removing the fields here is time consuming and so I would not recommend it. When you hit ok, this will create a new layer with the join and the original data.
Deleting Fields
When exporting the features to a new layer, all fields will come with it. I mentioned in the export feature dialog you could remove and change them there, but it is time-consuming. The easy way to remove them is to run the Delete Field tool. This tool is found in the
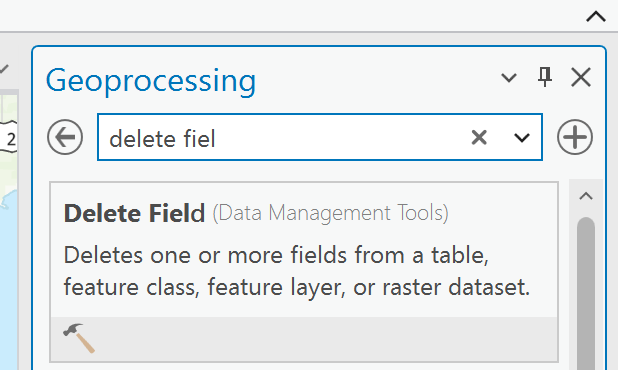
Open the tool and set the input table to be the Feature Export that you created above.
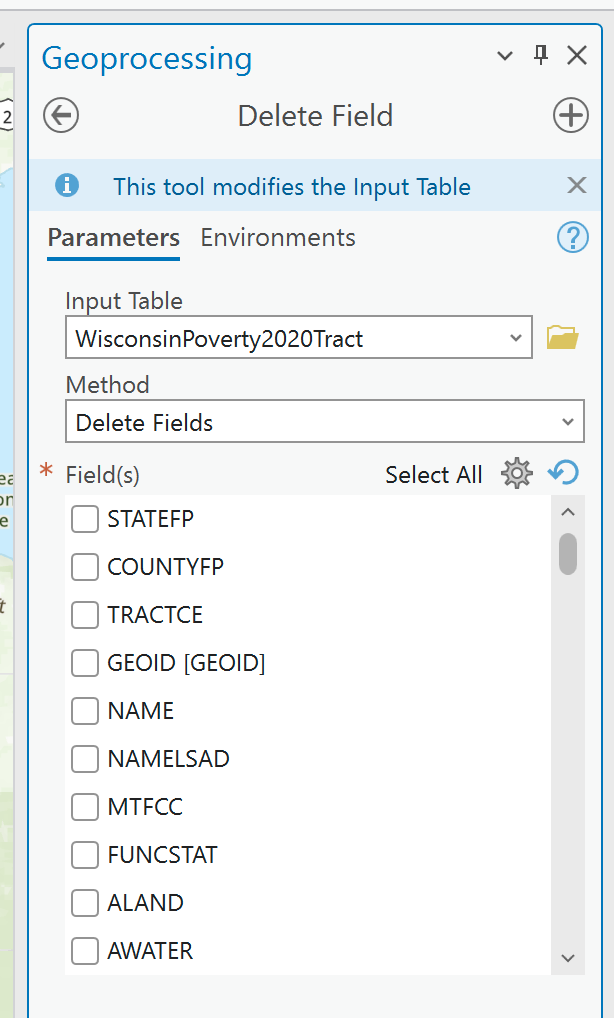
Now you can start to select your fields to delete. Because there are so many I would recommend clicking Select All and then working backwards and unchecking what you need. I would also keep at least the GeoID_Data field and the census identifiers so you can go back and add data later. Also, if you are working with an area with census tracts in the water keep ALAND so you can filter them out (see part 1 on how to do that).
Publishing to ArcGIS Online
Now if you want to use this map in any web application (like a story map), you will need to publish the map. This is easy and if you have prepped your data using any of the methods above. J
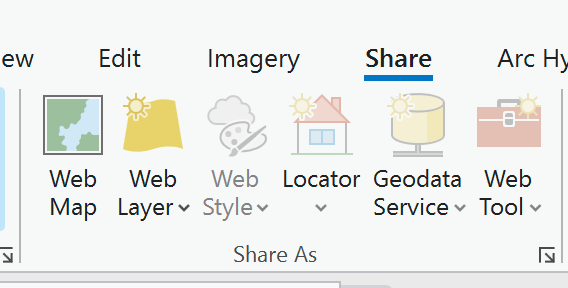
First, remove any extra tables in your project, this will mitigate any errors. Then go to the Share Ribbon and Share as Web Map.
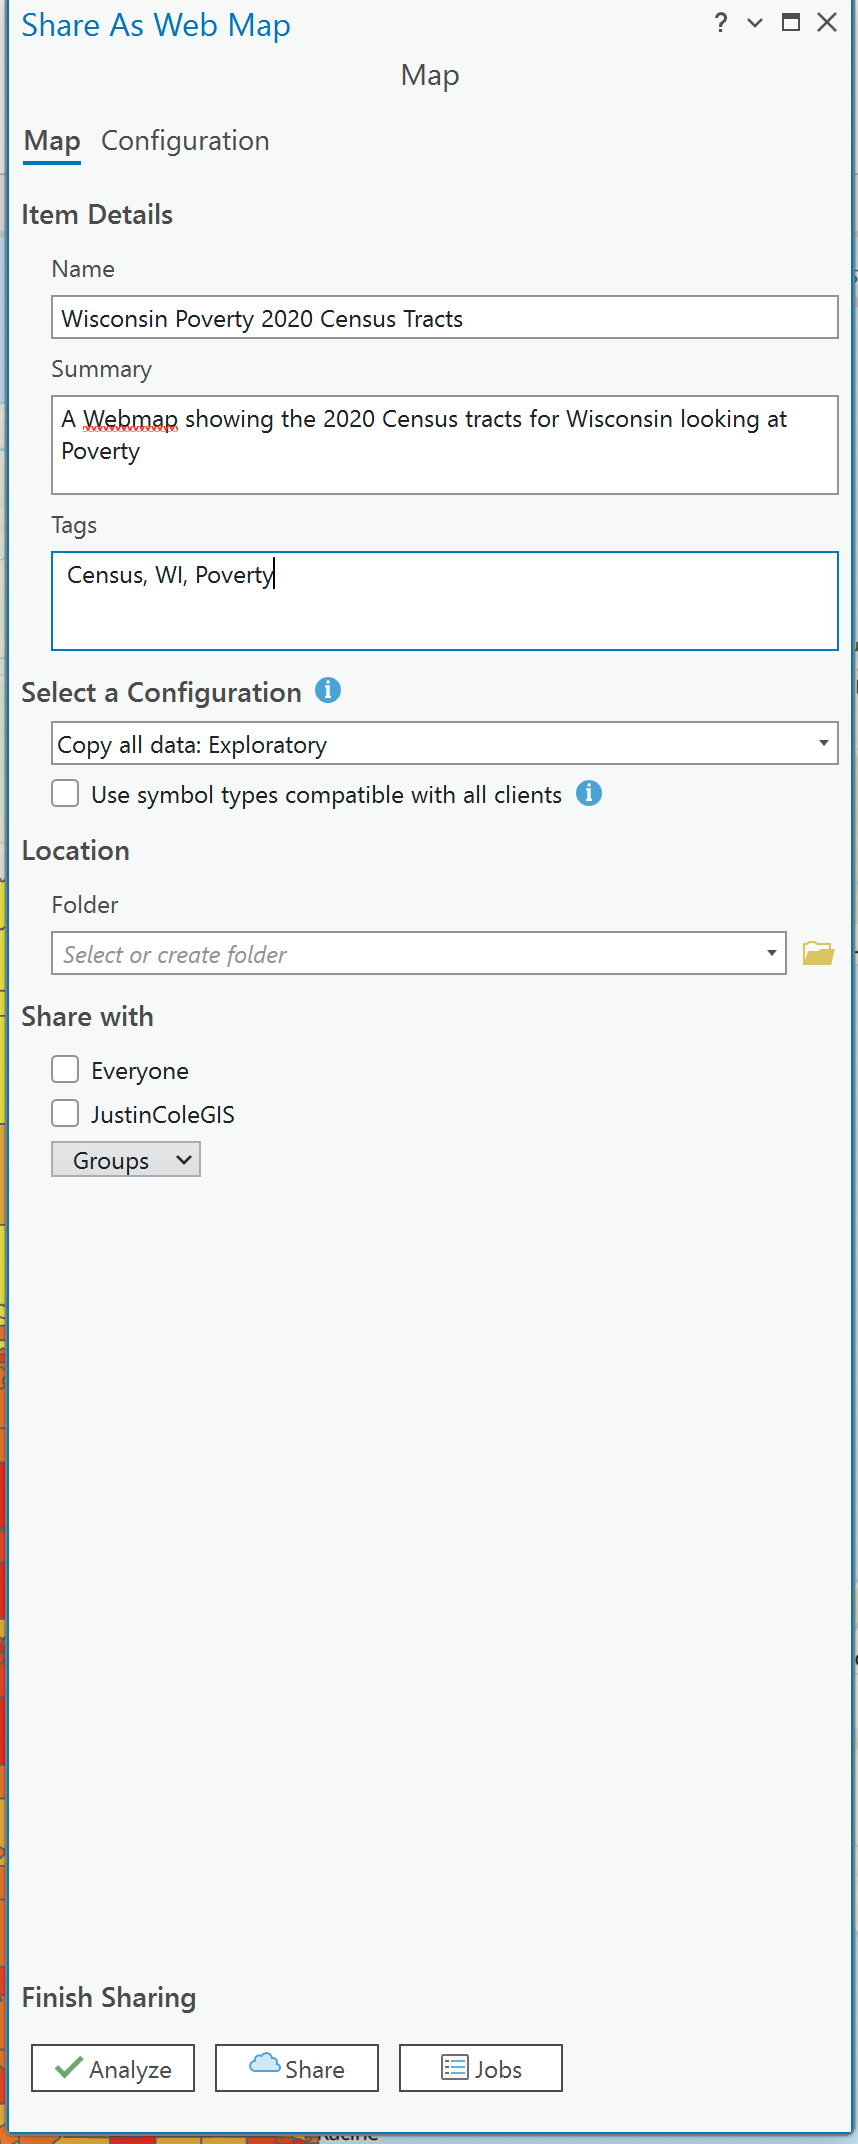
Now fill out the Share as Webmap Task. First, make sure the map has a good name, the default will be Map and will probably be already taken if you are using an organizational account. So just like the Feature Export give it something that you can identify what it is. Then a brief summary and tags. The summary is helpful for someone else using it to know about the webmap and the tags are good for quick searches. Once that is set make sure it is set to exploratory (you do not need to change it to editable since there is not a good reason to edit census data). You can also set the sharing properties here, which I would recommend so you do not forget to do it later. Lastly check for Errors using the Analyze Button.
When you click analyze you may get some errors.
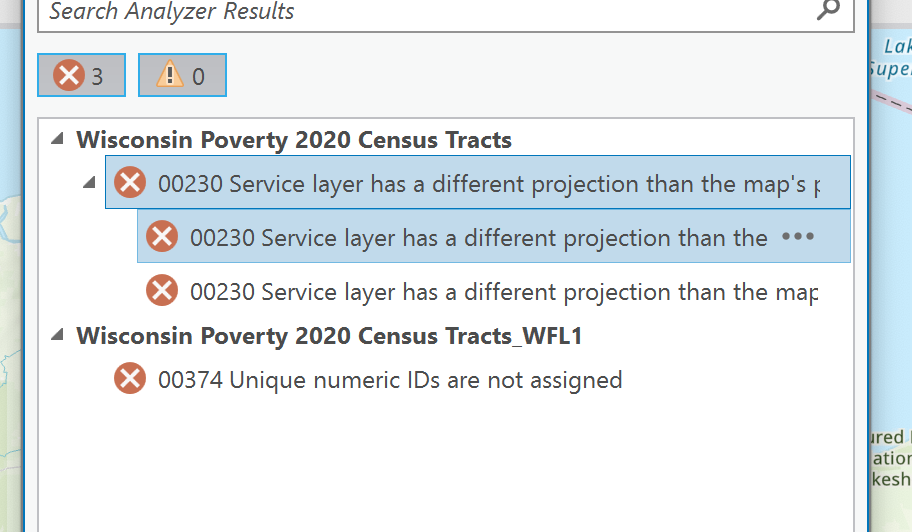
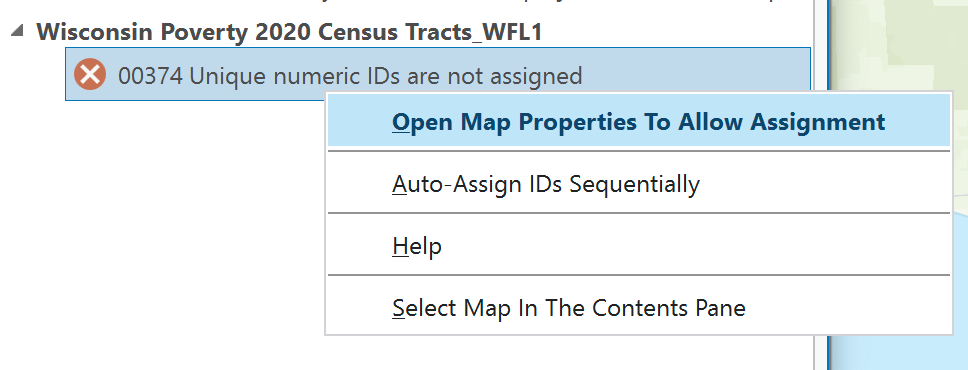
Many of the errors can be fixed by just right-clicking

Others may need you to go into a different window to turn something on.
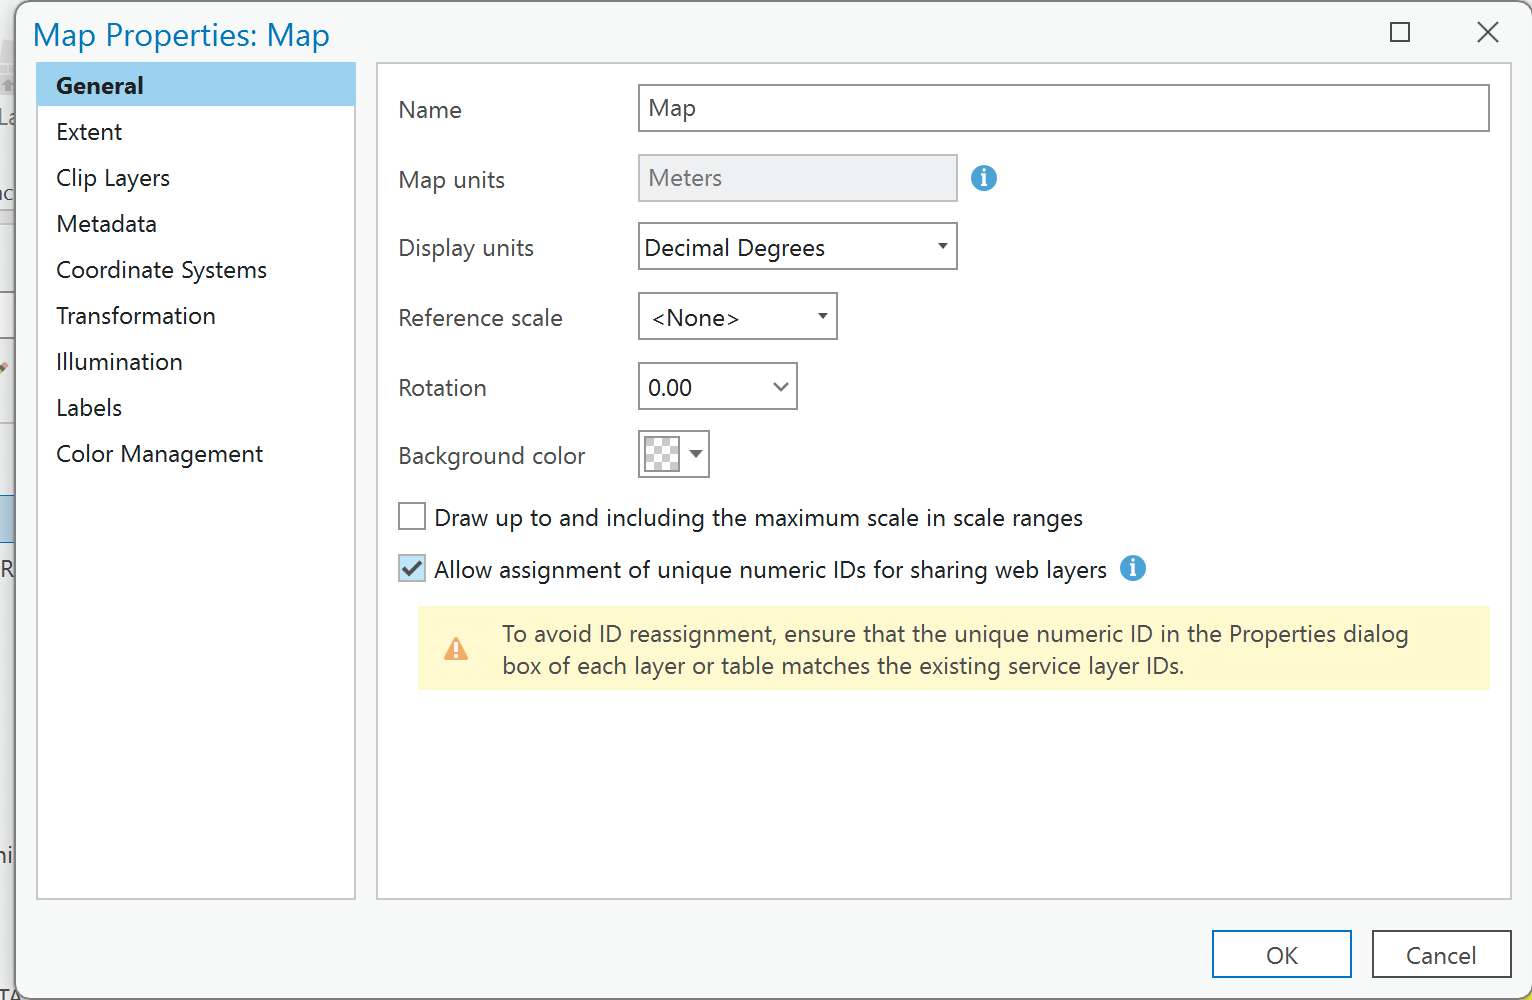
Once all of the errors are fixed then you can click Analyze again to double check and if it is all good then you can publish the webamp.
