I just saw that the NYS Redistricting Maps were rejected (https://www.whec.com/national/judge-rejects-new-yorks-redistricting-plan-orders-new-maps/6434302/?cat=10036). When I worked in local government I helped the board of elections in the redistricting process by providing training and getting the Census data into a GIS Project for them. With a lot of grassroots organizations out there trying to work with the process, I just want to help by providing a brief walk-through of an ArcMap tool for districting. This tool is one of the two tools that have not made it into ArcGIS Pro and is the reason that I still have ArcMap Installed.
Data Sources:
- 2020 Census Tiger Line Shape Files – https://www.census.gov/geographies/mapping-files/time-series/geo/tiger-line-file.2020.html
- 2020 Decennial Census P.L. 94-171 Redistricting Data – https://www.census.gov/programs-surveys/decennial-census/about/rdo/summary-files.html
Districting for ArcGIS
ESRI has a great online redistricting tool, but I have always preferred the local tool because I have more control over what I am seeing in the data. There is an older ArcMap extension called Districting for ArcGIS which you can get following this link https://www.esri.com/en-us/arcgis/products/districting-for-arcgis/overview. This extension allows you to district using any polygon layer and I have used it not only for election districts, but to help fire departments, utilities, and even schools with bussing. The key to using this is you need a number attribute and small enough polygons that you can merge them together and not need to make custom changes. Most of the time I use Census Blocks because this is the lowest size polygon that the census uses and blocks make up all of the other features of the census. This tool has a process to setup, but once setup it is easy to use.
Walkthrough
- In the Districting Tool Bar click Districting -> Districting Admin -> Create New Plan

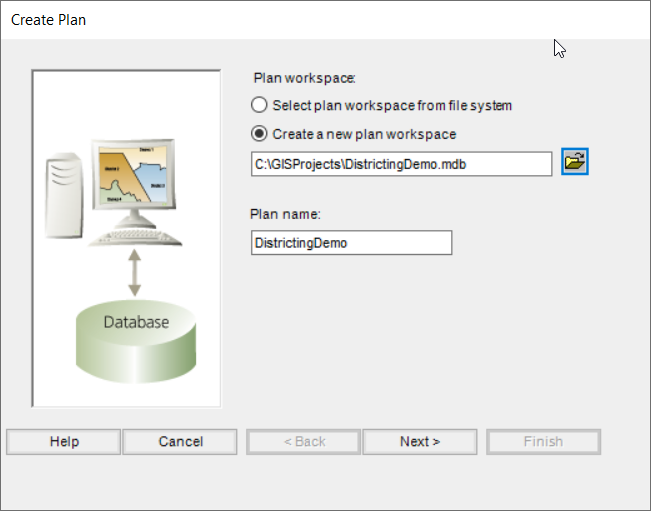
2. Create a New Plan workspace and Give the Plan a Name. One of the cool features of this tool is you can have multiple plans under one workspace.
3. You then need to pick and load your data. You can use prejoined data or you can use a feature class and a table that is joined together. In my example, I will use prejoined data. I set the source geography key field to the geoid because that relates to the blocks and is used to describe the districts. Then the data fields I set to a value. In this example, I will use the same field of population, but the optimal value field can be used for other attributes that you want to use.

4. Set the number of districts that you want.

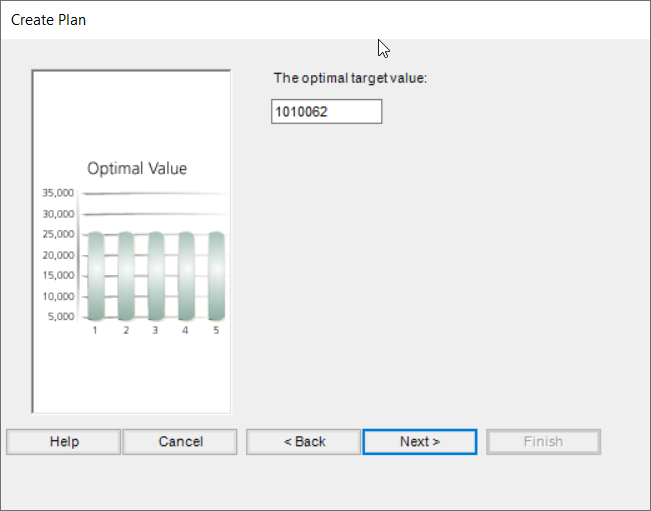
5. The optimal target defaults to the total field value divided by the number of districts. If you want to adjust it you can.
6. Now you can pick other fields that can either be summed or a percentage value as you create your districts. This is helpful if you have other demographic data you want to see.

7. Click Finish and it will create the plan workspace and project.
8. Once the data is loaded and the map is up you can start the Districting Process. To start the process click the Districting then Start Editing.

Note: If you want to add other layers like previous districting plans you can add them, but just make sure they are not selectable.
9. Start by changing the dropdown to District 1. Also, the last 2 buttons are a graph and table window. This helps see how the districts are adding up and how they compare to other districts.

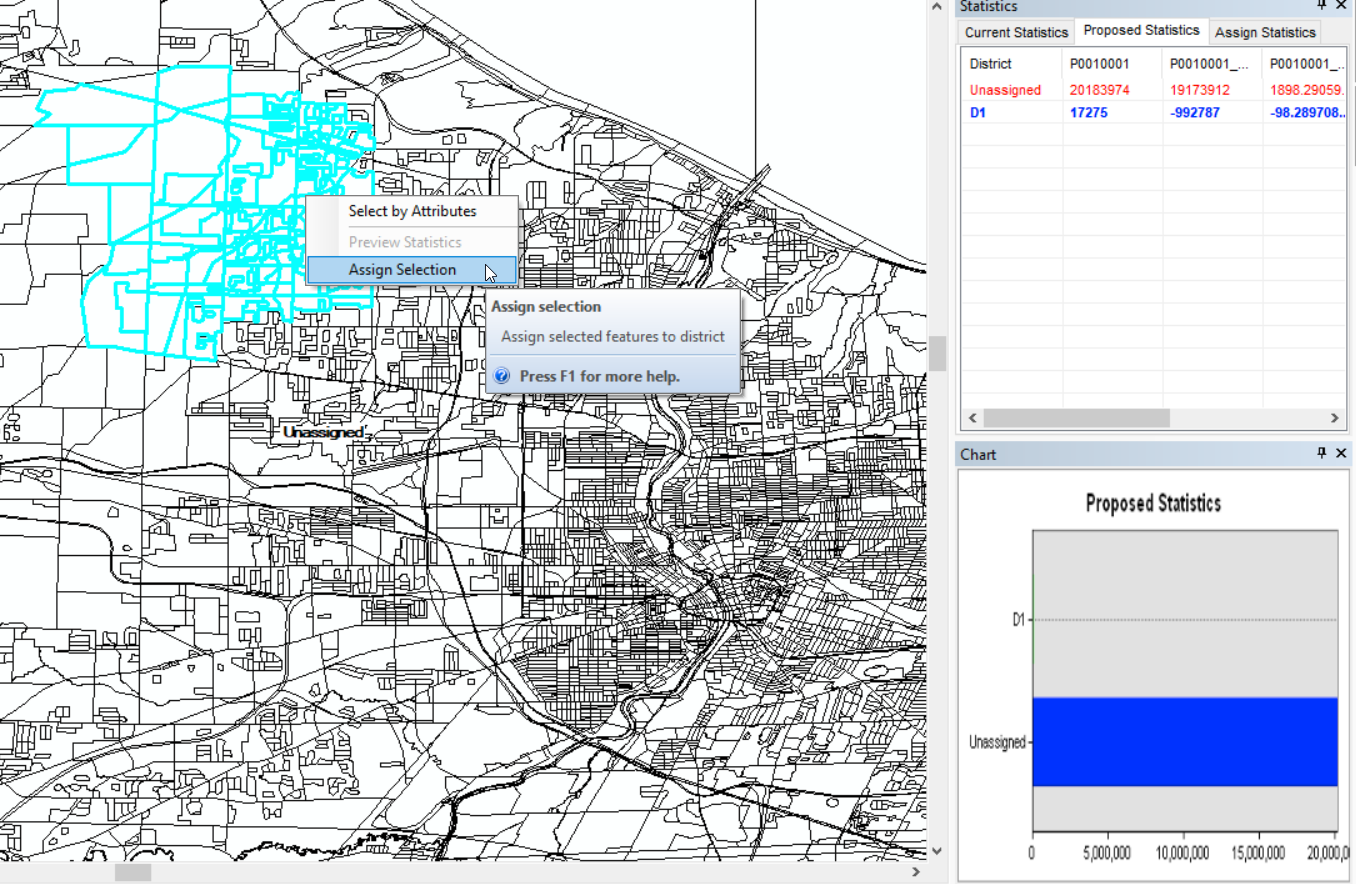
10. Now you can use the select tool and start selecting blocks to add to a district. When you add them right click and then Click Assign Selection to add them to the district. As you work you will see the statistics changing and the graph updating. For the most part, the goal of districting is to have equal populations and the graph will give you a good representation as you work.
11. As you work, like with anything in ArcMap, save often!!!

12. Once you are done (or done for the day) stop editing
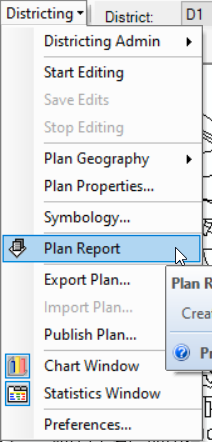
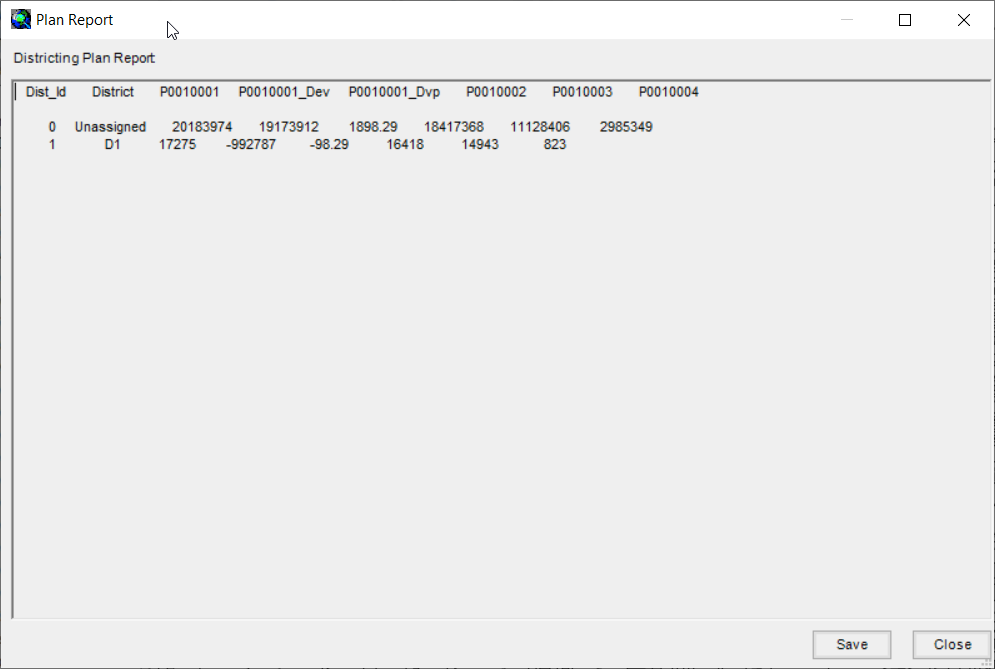
13. One of the other cool functions is you can generate a report of each district by clicking the report button.
Once the districts are set you can then use any of the other normal tools in ArcGIS to publish them either as a map, webmap, or export the data into new feature classes and work in whatever environments you want to work in.
