I teach a lot of cartography courses, and one thing we talk about in them is how to make maps more accessible. For the most part, we are talking about making them colorblind-friendly (for example ColorBrewer). I felt that this is a gap that is in many cartography classes, so I thought about what new technology is out there and what we can do.
When 3D printers first came out, I saw a few street network maps that had limited information but were made for people with visual impairments. I thought that was really cool, and something that I would like to try. Those maps were basically 2D prints with streets and negative space for not being a street. Some had braille, but with the Fused Deposition Modeling (FDM) printing at the time resolution was limited. Masked Stereolithography (MSLA) printers are another type of printer and can produce a lot more detail. I purchased an MSLA Mars 2 Printer for fun and one of the projects has been to create a 3D printed map that has a lot more detail and can be read by touch.
The process uses either ArcGIS or QGIS to create a custom elevation model. The last step is a QGIS Plugin called DEM to 3D, which creates an STL 3D file type that can be used in 3D printing slicing software. This walk-through uses ArcGIS Pro to process the data and you will need the 3D analyst extension. This is the method that I used to create my 2022 GIS/SIG Map Contest Winning Entry (http://gis-sig.org/2022/04/07/2022-gissig-conference-map-gallery/).
Click Here to Support the ArcGIS Pro Idea to add the ability to export to STL
How to Get the Data Ready For Printing
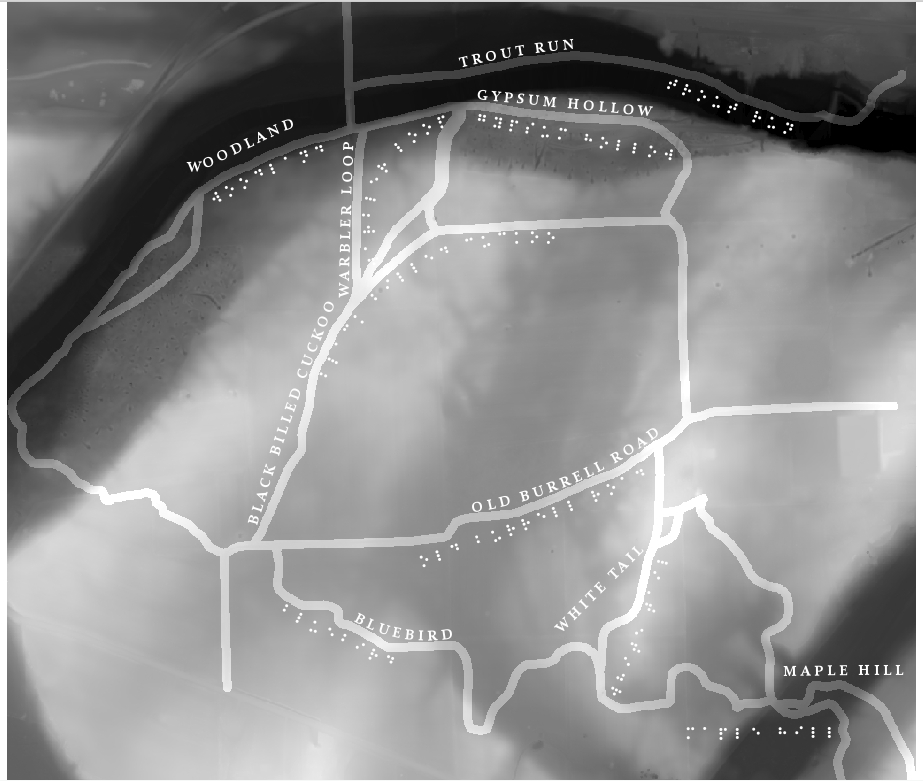
- Pick your area and get any data you want to use. In my example, I will be using a small sample of LiDAR from Monroe County and the Oataka Creek Trails from Monroe County’s Part Trail layer, both accessible from https://www.monroecounty.gov/gis-Data.
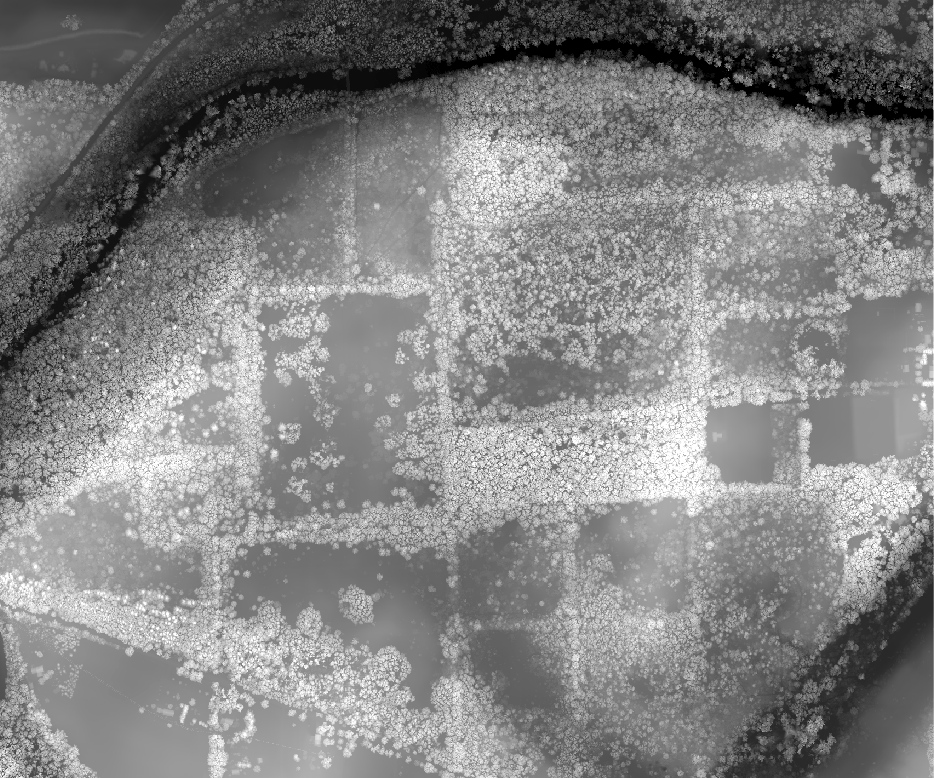
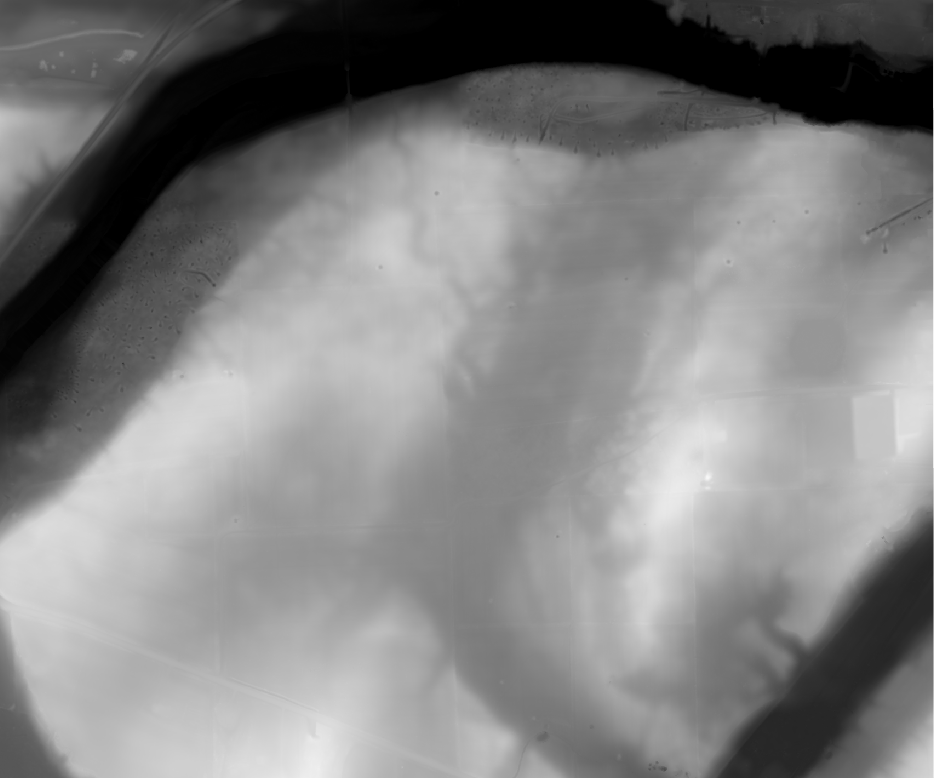
- Process the elevation data to create a surface that works for you. I tried a few different return types and found that the bare earth elevation worked the best.
- Now lets look at the trail layer. The trail width ranges from 6-25 feet depending on where you are in the park. I created a buffer of the trail to 25 feet. You could make it more accurate if you had an attribute in the feature class, but for this example I made it the maximum, just to have it stand out better.
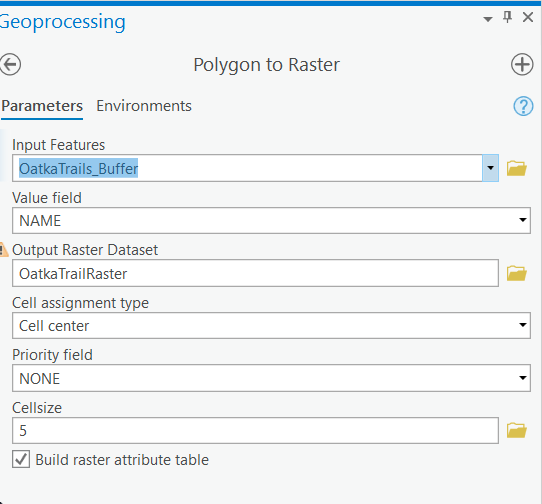
- Now I used the Polygon to Raster tool to make the trails into a raster layer. Make sure to use the elevation’s pixel size so when you work with the next part you have the same size pixels.
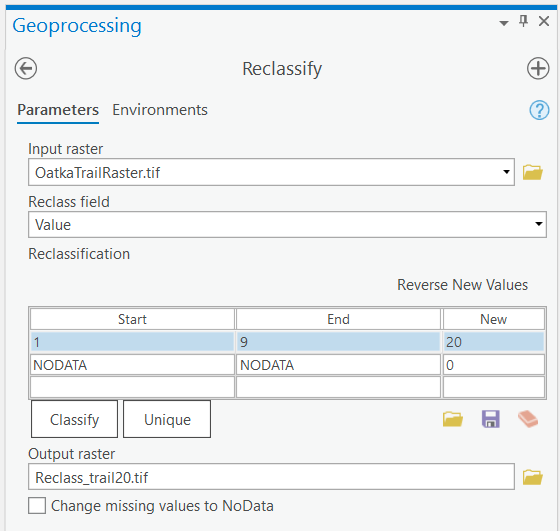
- Now we need to make the trails stand out fro the base elevation but also keep the same elevation profile as the bare earth. To do this you take the trail raster layer and first reclass each trail to be a value of how high you want it to appear off the map. I tried a few options in the printing process and found that at the scale that I was using 20 feet worked the best.
- Now that you have the Trail Raster set to a value of 20, using Raster Math (Plus Tool Geoprocessing) add in the elevation model. That will give you the result of the elevation plus the 20 foot trail layer.


- Now comes the hardest part of the process, adding the labels in both Braille and text. My first attempts was to use the Microsoft 3D Builder and manually place the text after. I was not fully happy with this but it worked. In thinking about new methods I used the ArcGIS Label engine and made 2 copies of the trail layer. I placed 1 layer above and 1 below each. For the braille I just searched online and found a braille font that was available (https://brailleinstitute.org/freefont). Then I converted the labels to annotation and moved them so they were in the best places I could find and not on the trails.
- Once you are happy with the labels, export the map as an image with world file. Make sure to use the 8 bit grayscale option and enough of a resolution to look good when exported.
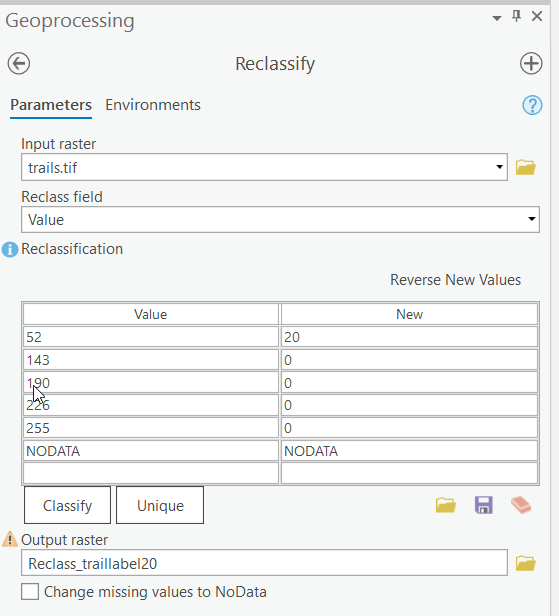
- Now bring the trail label exported image back in and reclassify the value of the text to be the value that you want it offset matching the other layer. Make sure to set the other values to 0. Some of this is trial and error trying to get the best result. In the screenshots I did 20feet to match the trails.
- Now use the Plus tool again and add the lables to the trail elvation model. Make sure to save the final result to a tif so we can bring it into QGIS.

- Now we can take the resulting Trail Raster and bring it into QGIS. Add the data into a blank project.
- Use the Plugin manager and install the DEMto3D Tool

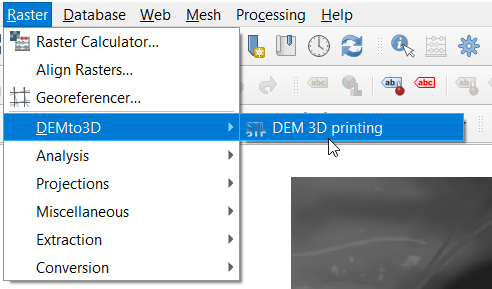
- Open the tool which can be found under the raster menu DEMto3d and DEM 3D printing
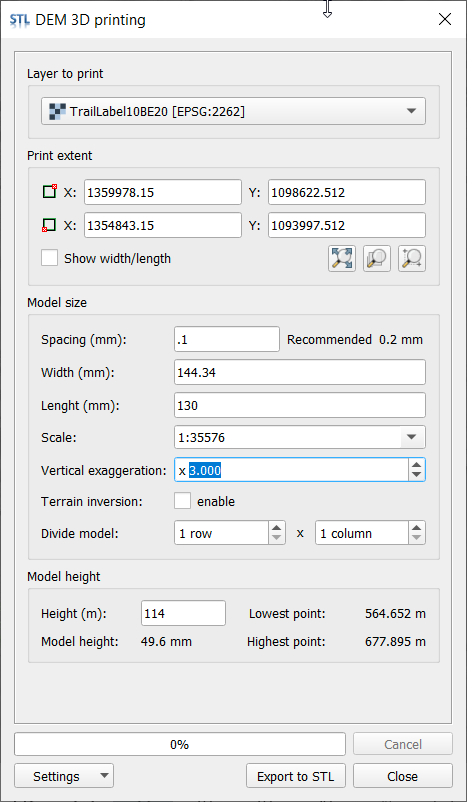
- Now with the DEM 3D printing window, set the layer to be your elevation model. I use the full extent option and then I make the model roughly the size of the printer bed size . I also adjust the model height to match the height of the elevation changes (in meters). You can also set a vertical exaggeration to show more detail if you want. Again, this process is a bit of trial and error but once you get it set and created then you are good. The export processes which will take a bit of time.
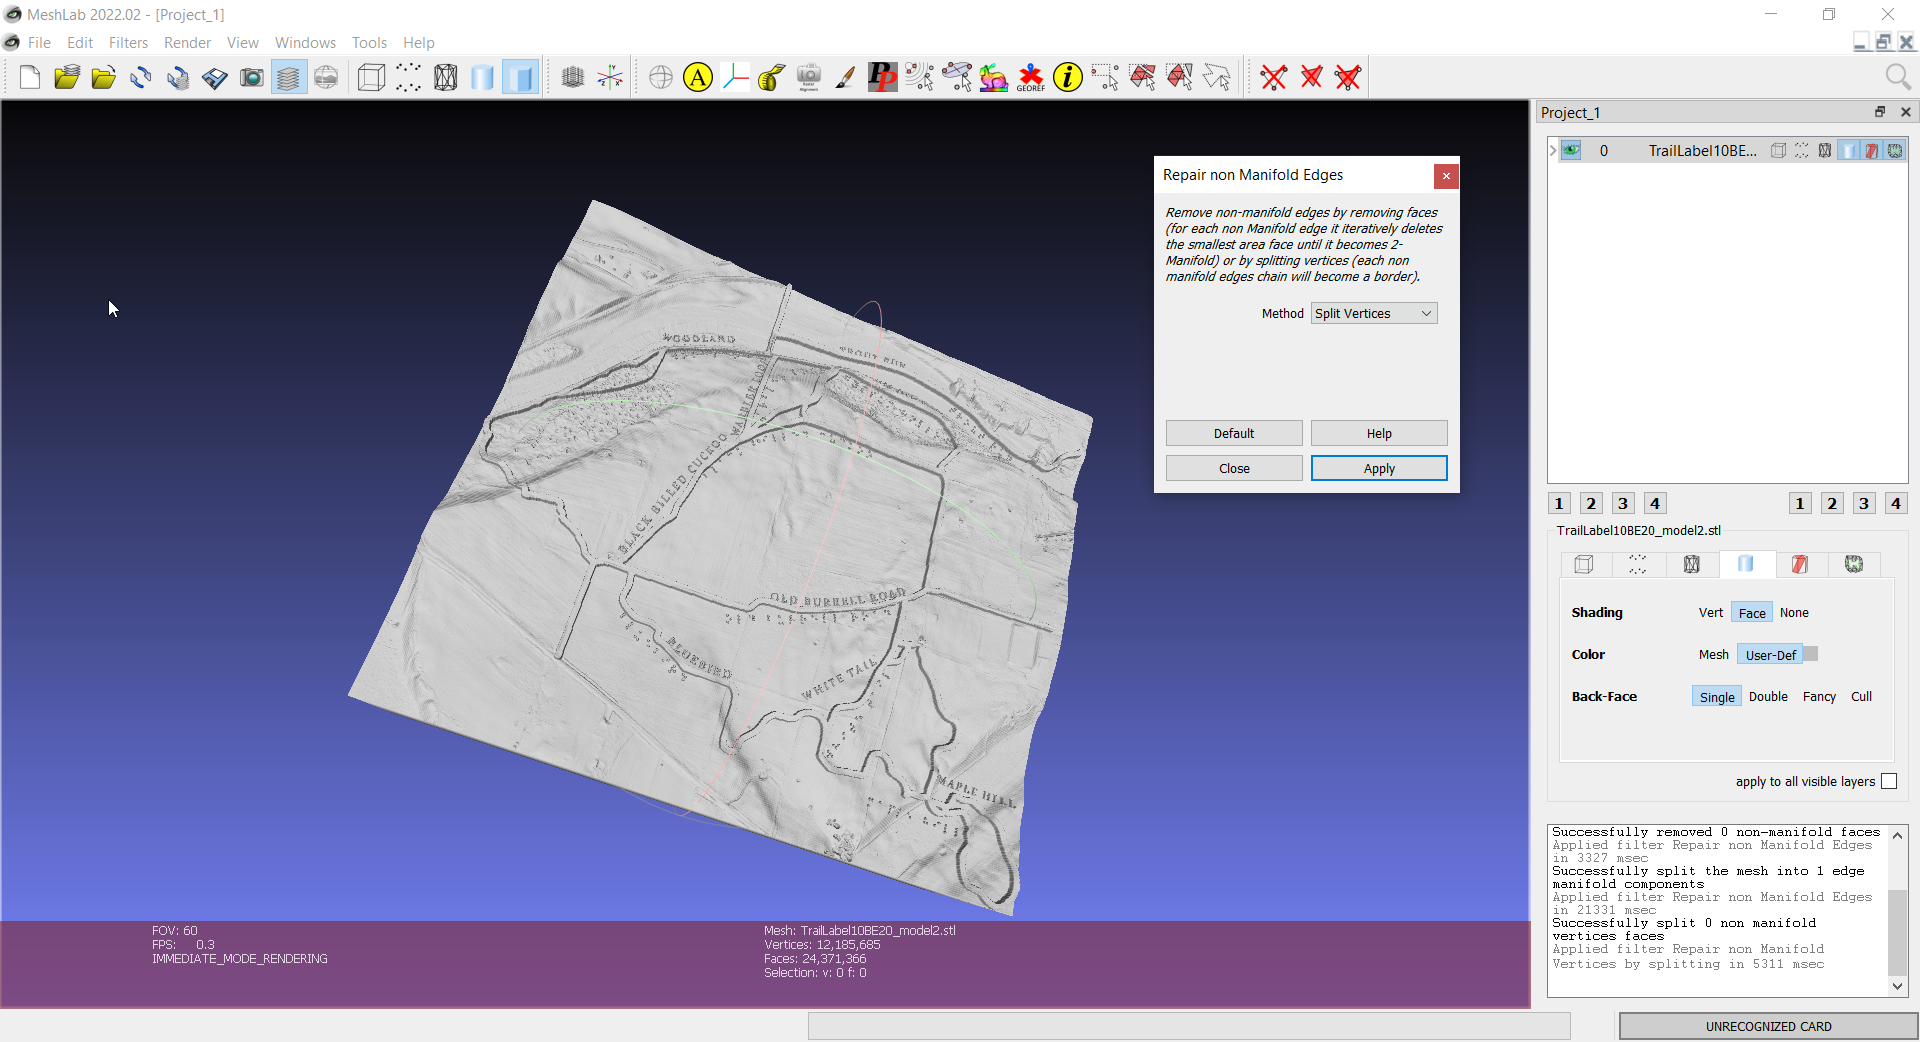
- Now you can bring it into any 3D software to clean up. First, when you bring in the file it needs to be repaired. I use MeshLab https://www.meshlab.net/ to repair mine just because it can handle the size of the files easily. Then I use microsoft 3D builder to edit the STL for the final product. I usally remove execcess height on the model and edit the model as you would like the finished product to look. This is where I usally add things like north arrows or text on the edge of the print.

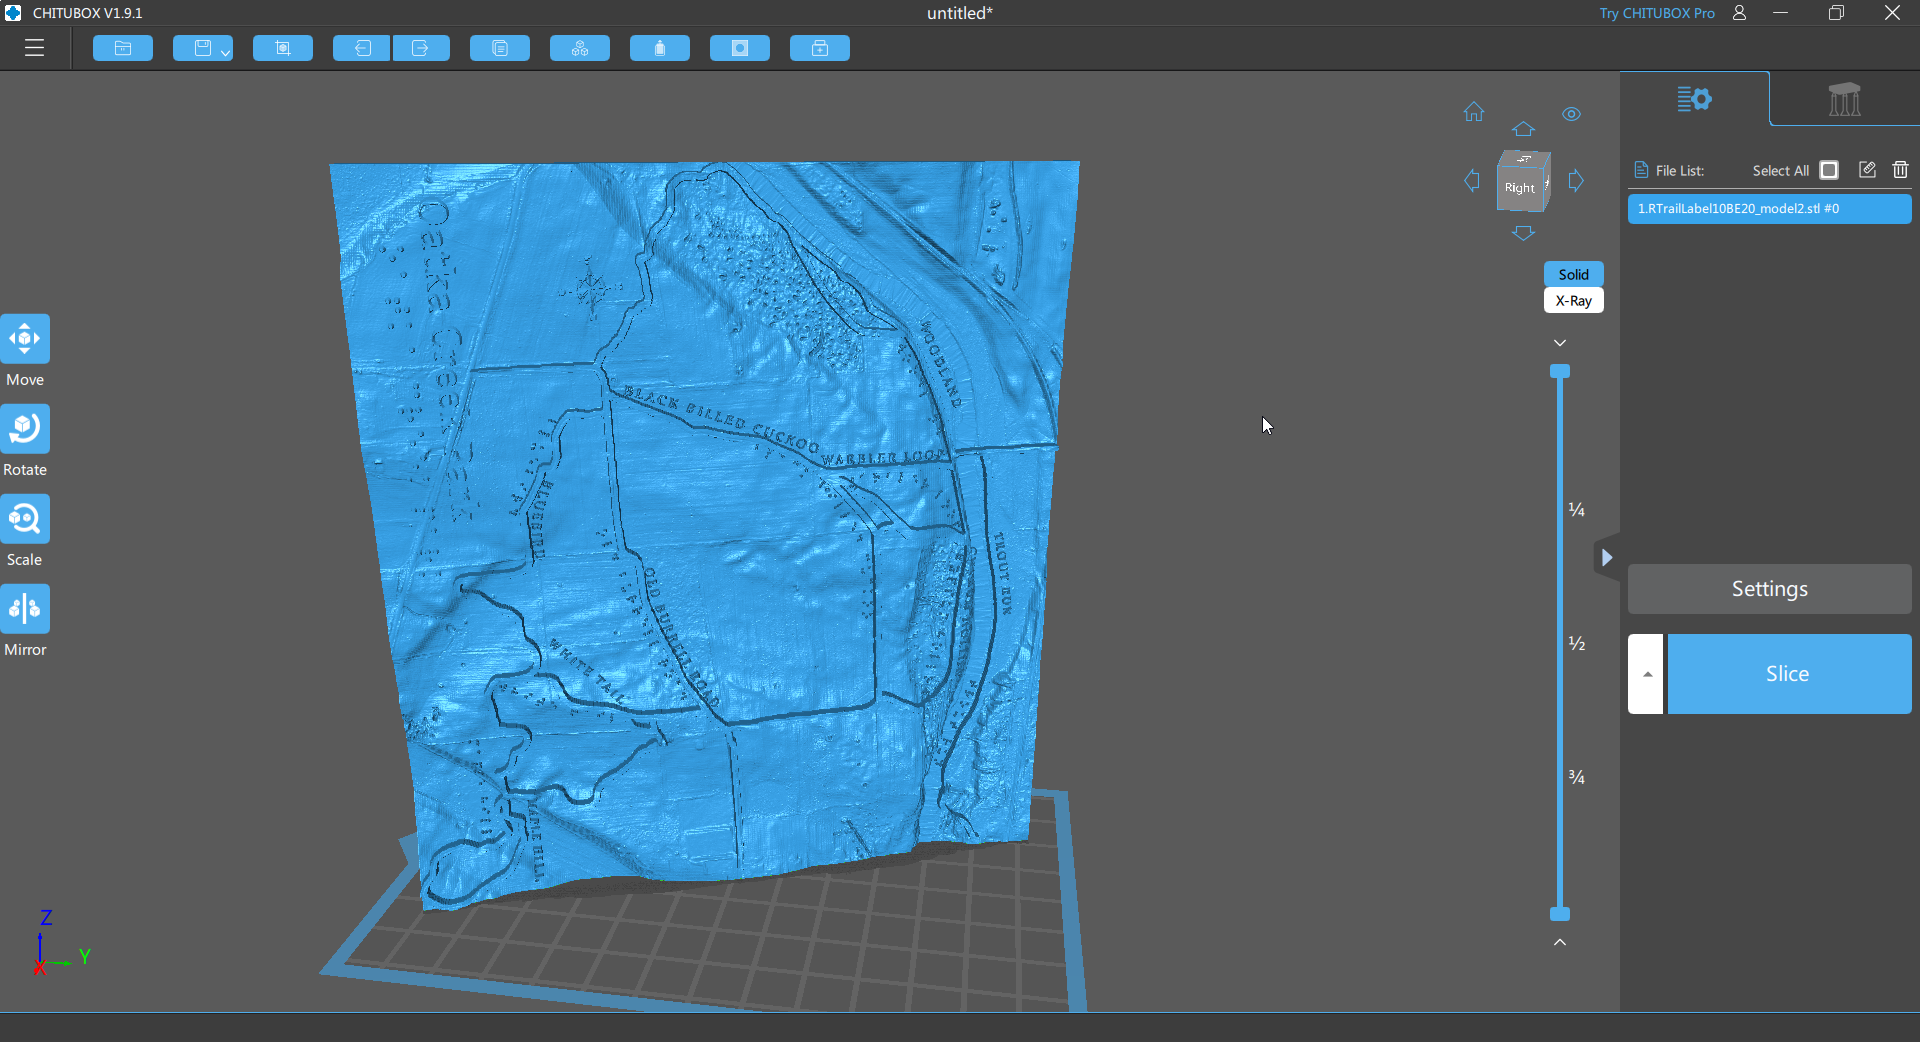
- Now you can bring it into your 3D Printer’s slicing software and get the print all setup and ready. The settings here depend on your individual printer. Mine uses Chitubox and it has a profile for my particular printer. When printing I do recommend making sure it is hollow just to save on material.
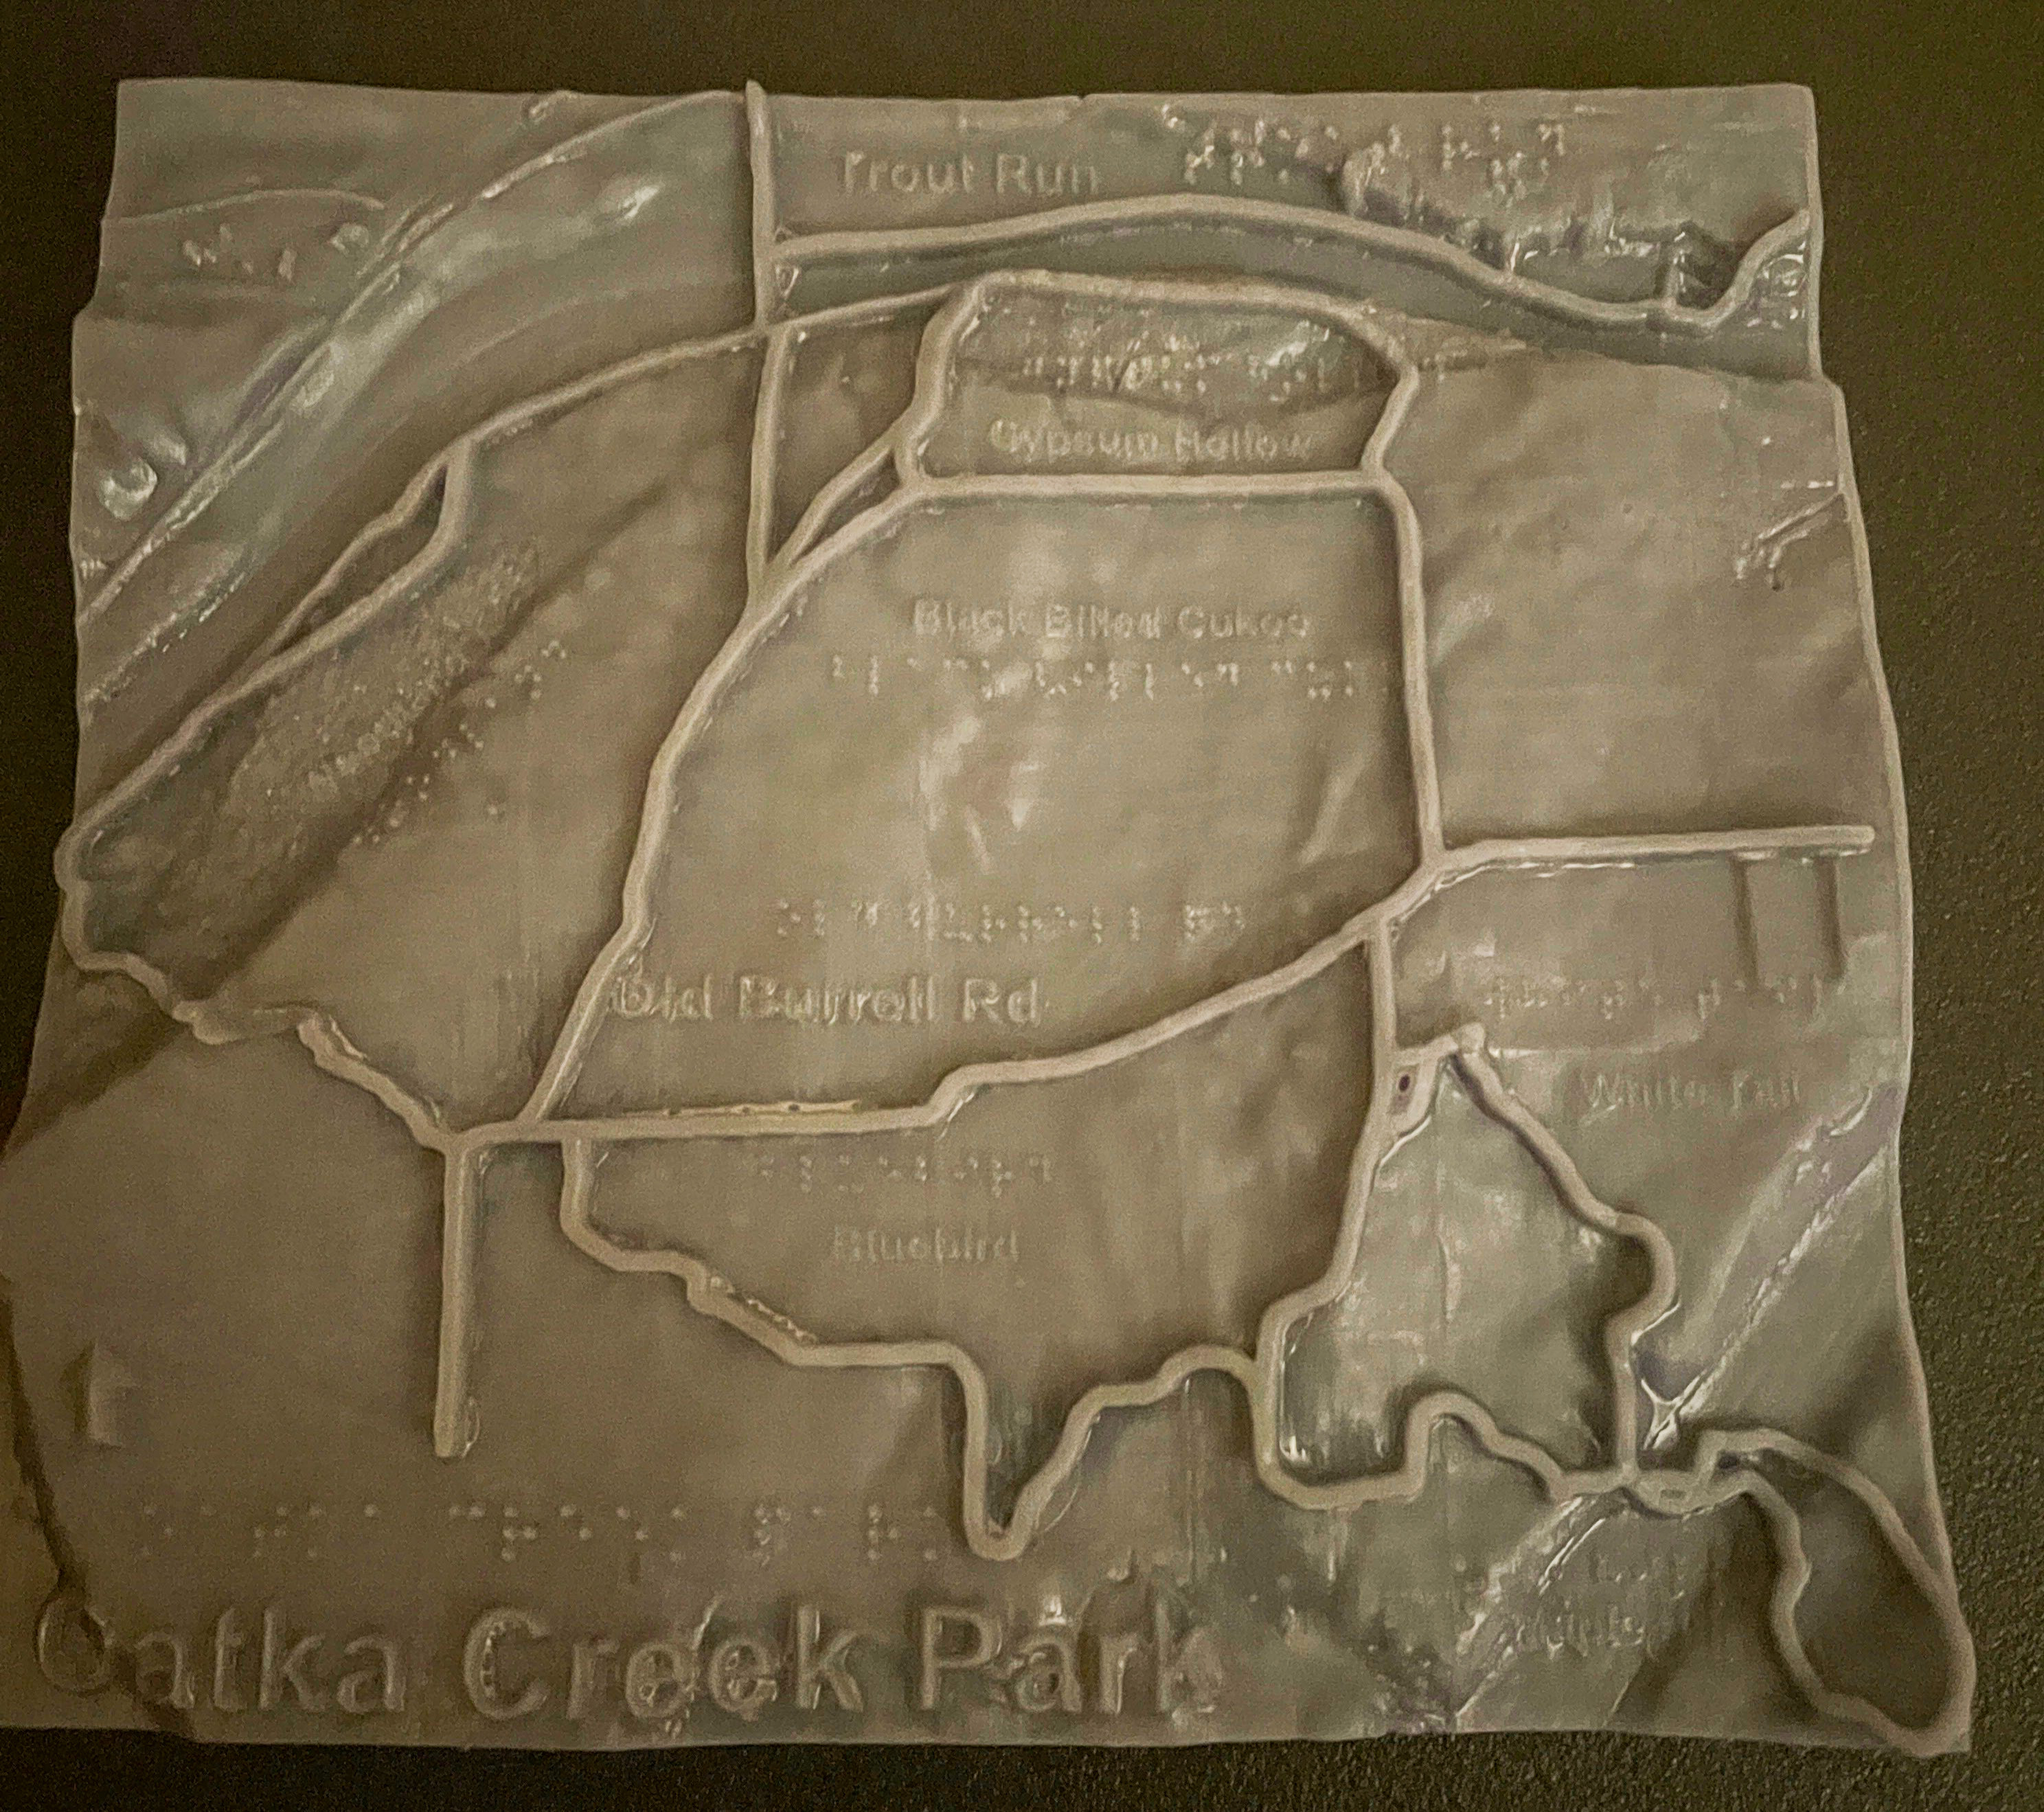
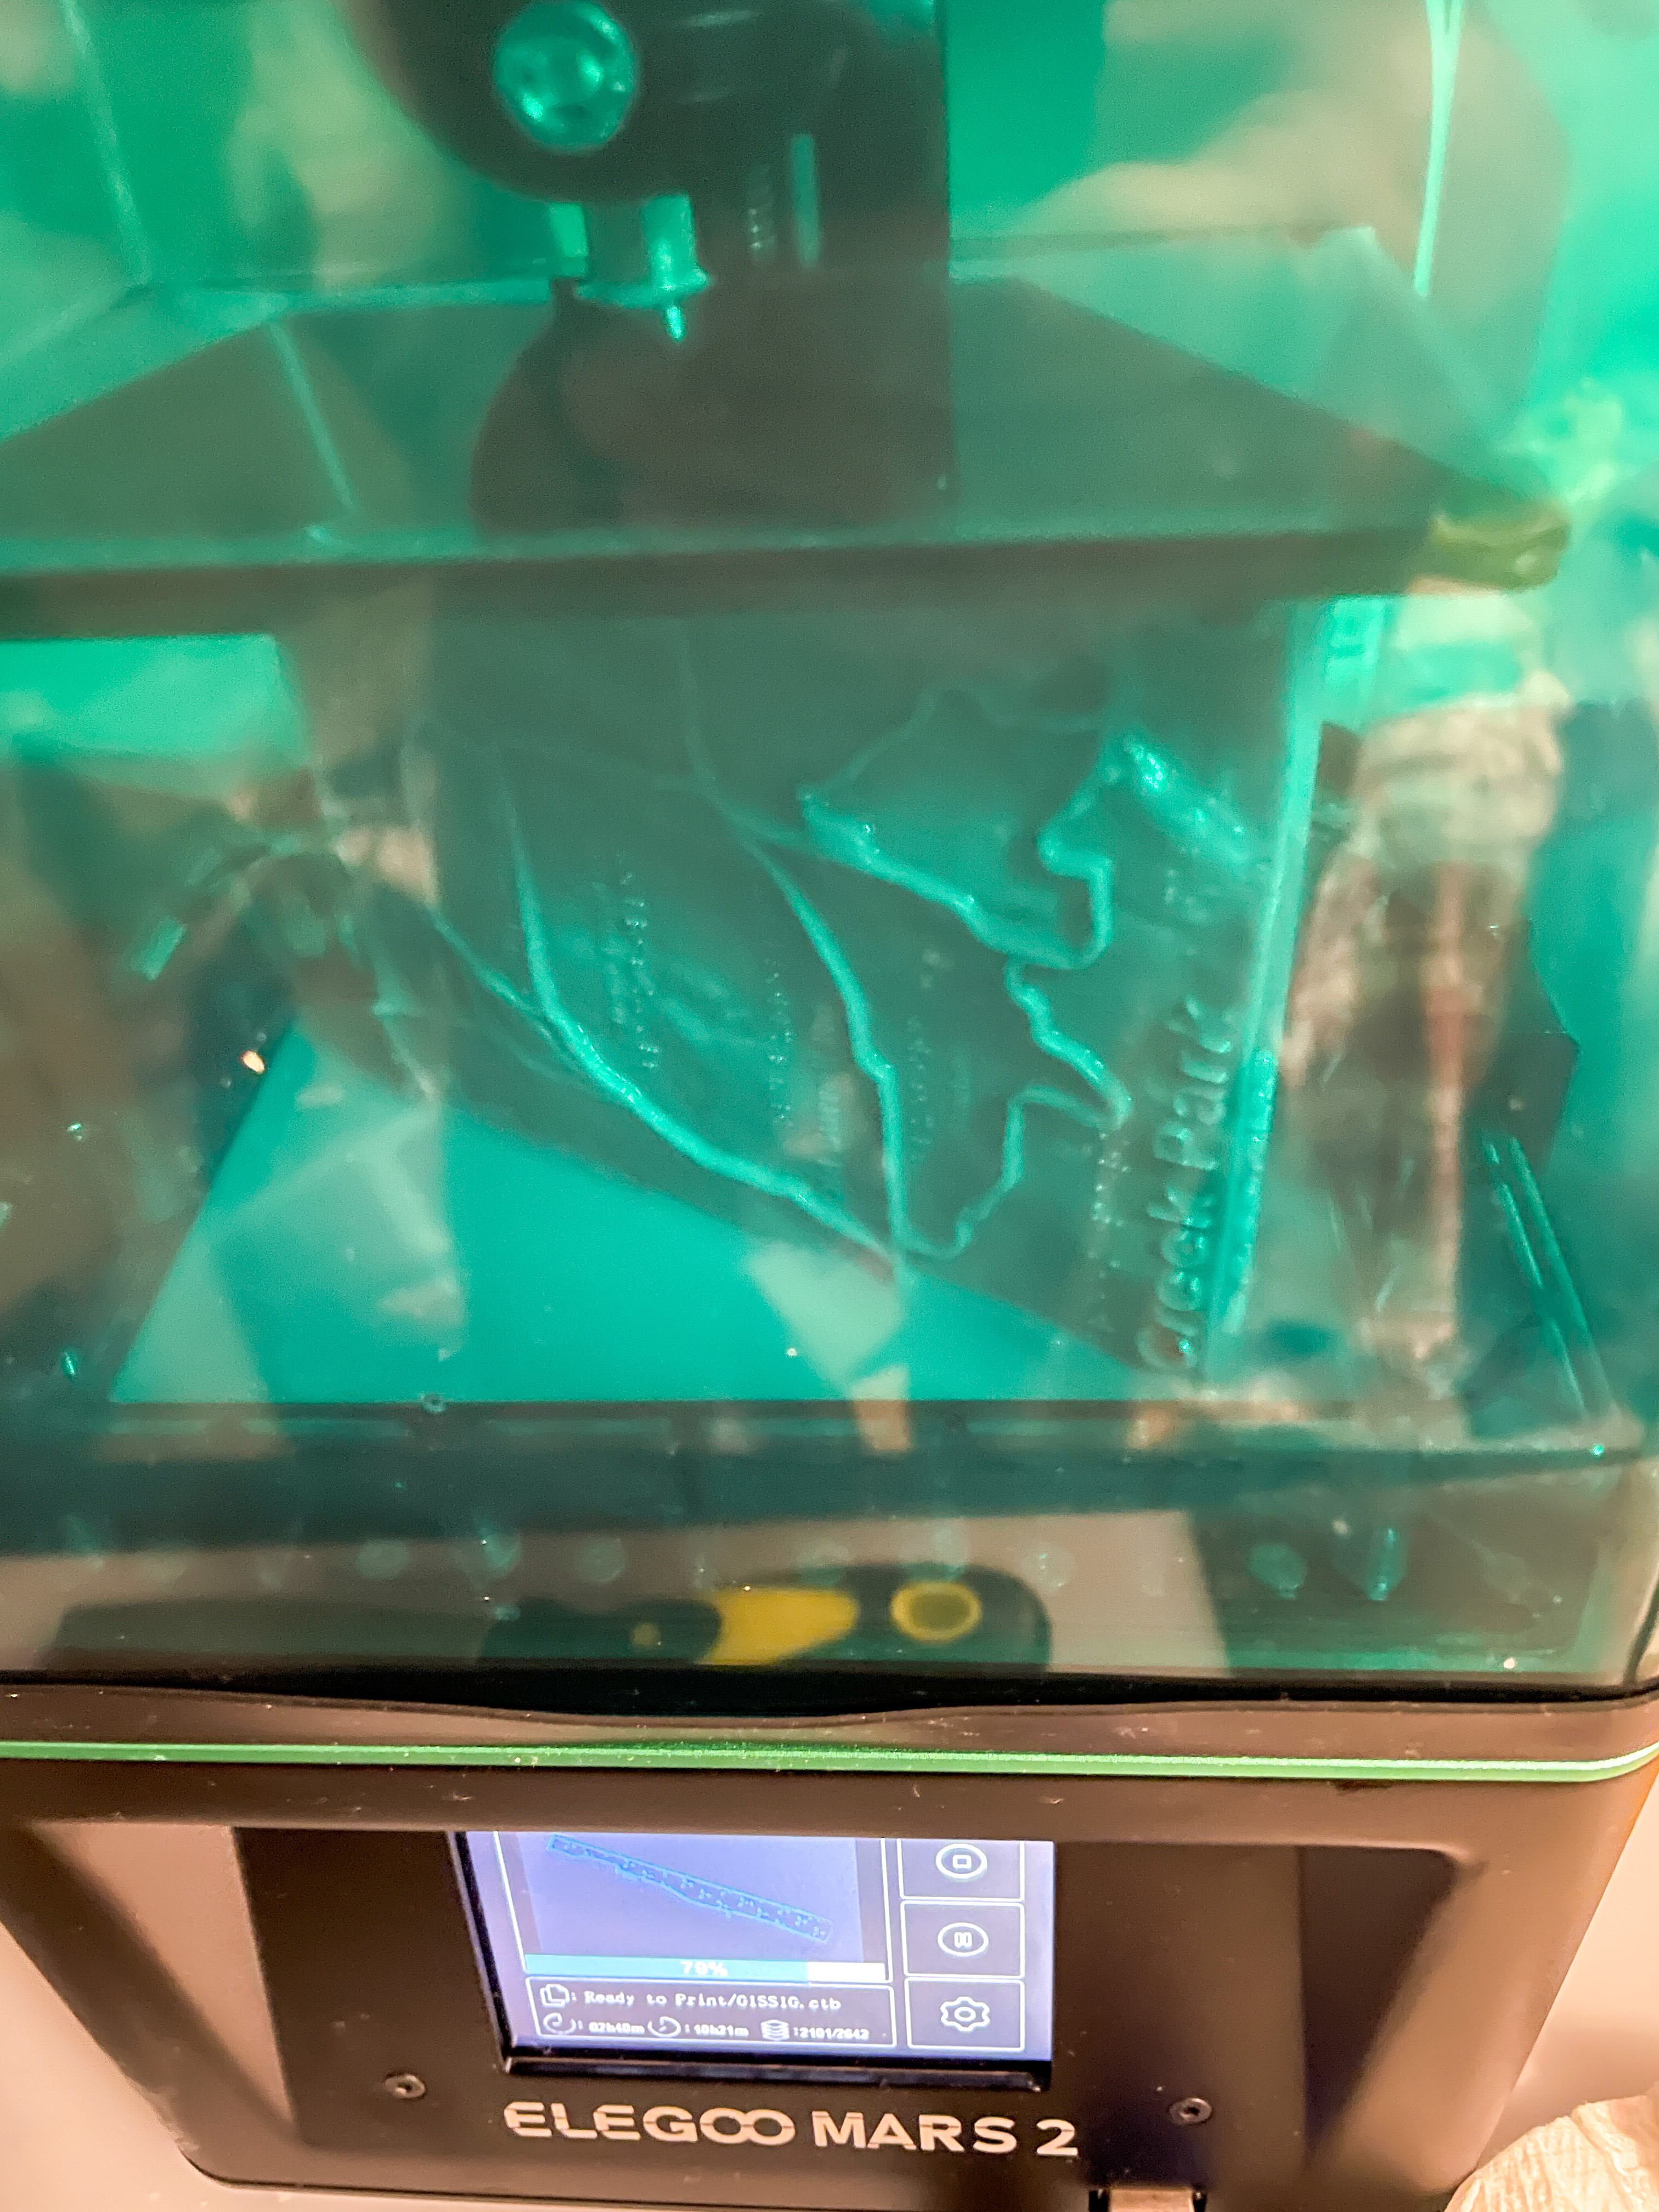
- If you want now you can use other tools and play around with the settings to create a final map that works best for your process. Once you start to print it may take a while to finish. My map took about 13 hours to print.

One thought on “Creating a 3D printed Trail Map for People who are Visually Impaired”